Visualizing Chromatin and Telomeres with CRISPR: A Comprehensive Guide for Life Science Researchers
This article provides a detailed exploration of CRISPR-based imaging for chromatin and telomere visualization, tailored for researchers, scientists, and drug development professionals.
Visualizing Chromatin and Telomeres with CRISPR: A Comprehensive Guide for Life Science Researchers
Abstract
This article provides a detailed exploration of CRISPR-based imaging for chromatin and telomere visualization, tailored for researchers, scientists, and drug development professionals. It covers foundational principles, cutting-edge methodologies including live-cell imaging and multiplexing techniques, practical troubleshooting and optimization strategies for enhanced signal-to-noise ratio and specificity, and a comparative analysis with traditional methods like FISH and TALE. The content aims to serve as both an introductory resource and an advanced technical guide for implementing these powerful tools in dynamic genomic studies, disease modeling, and therapeutic target validation.
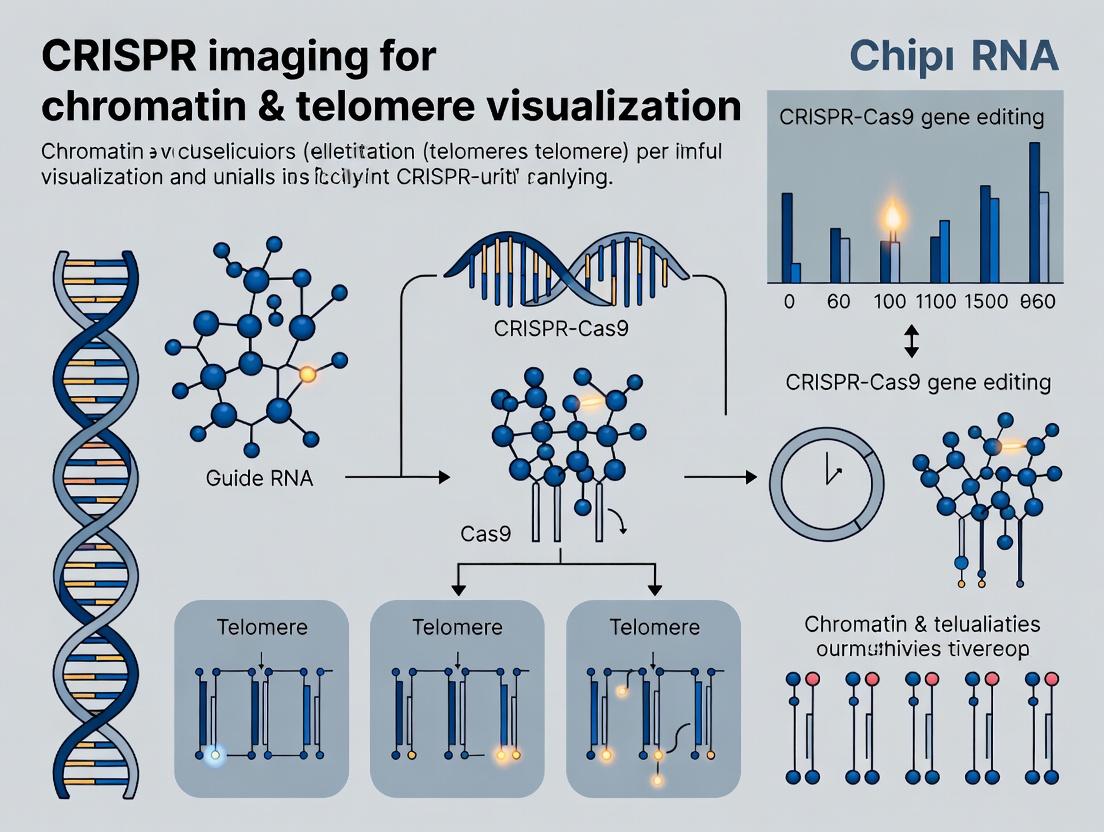
CRISPR Imaging 101: From Genome Editing to Visualizing Chromatin Architecture and Telomere Dynamics
The broader thesis of this research posits that direct, live-cell visualization of specific genomic loci is paramount for understanding chromatin dynamics, nuclear architecture, and their roles in disease. While fluorescence in situ hybridization (FISH) remains a gold standard, it is terminal and static. The repurposing of CRISPR-Cas9 into a nuclease-dead variant (dCas9) fused to fluorescent proteins has revolutionized this field, enabling programmable, multicolor, and live-cell imaging of repetitive and non-repetitive sequences, including telomeres and specific chromatin domains.
Application Notes & Key Quantitative Data
Table 1: Comparison of CRISPR-dCas9 Imaging Systems for Chromatin/Telomere Visualization
| System | Target Sequence | Signal Amplification Method | Approx. Signal-to-Background Ratio | Best Application | Key Limitation |
|---|---|---|---|---|---|
| dCas9-EGFP (SunTag) | Telomeres (TTAGGG repeats) | 10-24x peptide array recruiting scFv-GFP | 35-50 | Live-cell tracking of repetitive loci | Larger genetic construct; potential steric hindrance |
| dCas9-3xPCP-GFP | Non-repetitive loci (e.g., MUC4) | Triple PP7/PCP stem-loops in sgRNA + PCP-GFP | 25-40 | Imaging single-copy genomic sites | Requires engineered sgRNA scaffold |
| dCas9-MS2-MCP-IFP2.0 | Telomeres / Centromeres | 24x MS2 stem-loops in sgRNA + MCP-IFP2.0 (Infrared) | ~30 (in infrared channel) | Multicolor, low-background imaging in live cells | Lower photon output of infrared FPs |
| CRISPRainbow | Multiple loci simultaneously | Engineered sgRNAs (MS2, PP7, boxB) + cognate coat proteins (CFP, YFP, RFP) | 20-35 per color | 3-color imaging of genomic architecture | Complex sgRNA design and validation |
| Casilio (dCas9-PumHD) | Single-copy loci | Pumilio-based modular RNA-protein recognition | ~25 | Highly modular, potential for high multiplexing | Currently lower signal intensity than MS2/SunTag |
Table 2: Performance Metrics for Telomere Visualization Using dCas9 Imaging
| Metric | dCas9-SunTag | Conventional Telomere FISH | Notes |
|---|---|---|---|
| Time per Experiment | Real-time to 60 min (after transfection) | 1-2 days (fixed cells) | dCas9 enables longitudinal study. |
| Cell Viability | Compatible with long-term live imaging | Terminal (cells are fixed) | dCas9 allows tracking over days. |
| Spatial Resolution | ~200-300 nm (diffraction-limited) | ~10 nm (with super-resolution FISH) | FISH superior for ultrastructure. |
| Quantification of Length | Relative intensity correlation | Absolute length measurement | FISH remains gold standard for absolute length. |
| Multiplexing Capacity | High (with orthogonal systems) | High (with sequential labeling) | Both suitable for multiplexing. |
Detailed Experimental Protocols
Protocol 1: Live-Cell Imaging of Telomeres Using dCas9-SunTag System
Objective: To label and track telomere dynamics in live human cells (e.g., U2OS).
Materials: Plasmid expressing dCas9-24xGCN4_v4, plasmid expressing scFv-sfGFP, Telomere-specific sgRNA (target: TTAGGG repeats), Lipofectamine 3000, FluoroBrite DMEM, chambered imaging dishes.
- Cell Preparation: Seed U2OS cells at 60-70% confluence in an 8-well chambered coverglass 24h before transfection.
- Plasmid Transfection: Co-transfect 250 ng of dCas9-24xGCN4_v4 plasmid, 250 ng of scFv-sfGFP plasmid, and 50 ng of telomere-sgRNA expression plasmid using Lipofectamine 3000 per manufacturer's protocol.
- Expression Incubation: Incubate cells for 24-48h at 37°C, 5% CO2 to allow for robust protein expression and genomic targeting.
- Microscopy Setup: Prior to imaging, replace medium with FluoroBrite DMEM supplemented with 10% FBS. Maintain stage at 37°C with 5% CO2.
- Image Acquisition: Using a spinning-disk confocal or widefield microscope with a 63x/1.4 NA oil objective, acquire z-stacks (step size 0.5 µm) every 15-30 minutes for up to 24h using 488nm laser excitation. Use low laser power to minimize phototoxicity.
- Analysis: Use FIJI/ImageJ to generate maximum intensity projections. Track telomere positions over time using particle tracking plugins (e.g., TrackMate).
Protocol 2: Two-Color Imaging of Telomeres and a Gene Locus using CRISPRainbow Objective: Simultaneously visualize telomeres (red) and a specific single-copy gene locus (green). Materials: Plasmids for dCas9, MCP-CFP, PCP-YFP, Com-mCherry; sgRNATelo (with MS2 loops), sgRNAGeneX (with PP7 loops); appropriate cell line.
- Construct Design: Design sgRNA_GeneX targeting a ~1kb region within your gene of interest. Clone into a plasmid containing the PP7 stem-loop architecture in the sgRNA scaffold. Use standard telomere sgRNA with MS2 stem-loops.
- Cell Transfection: Co-transfect HEK293T or U2OS cells with five plasmids: dCas9, MCP-CFP, PCP-YFP, Com-mCherry, sgRNATelo (MS2), and sgRNAGeneX (PP7). Use a total DNA ratio favoring the coat protein plasmids (e.g., 1:2:2:1:1:1).
- Incubation & Sample Prep: Incubate for 48h. For imaging, fix cells with 4% PFA for 15 min, permeabilize with 0.5% Triton X-100, and mount with DAPI-containing medium.
- Multicolor Imaging: Image using a confocal microscope with sequential laser lines: 405 nm (DAPI, nuclei), 514 nm (PCP-YFP, gene locus), and 594 nm (Com-mCherry, telomeres). Use narrow bandpass filters to minimize bleed-through.
- Colocalization Analysis: Identify foci in each channel. Calculate distances between telomere foci and the gene locus using centroid measurement in FIJI.
Visualizations
Title: CRISPR-dCas9 Imaging Mechanism
Title: CRISPR Imaging Experimental Workflow
The Scientist's Toolkit: Key Research Reagent Solutions
| Reagent / Material | Function / Role in Experiment | Example Vendor/Cat. No. |
|---|---|---|
| dCas9 Expression Plasmid | Expresses nuclease-dead Cas9, the targeting scaffold. | Addgene #47106 (pAC154-dCas9-24xGCN4_v4) |
| SunTag Effector Plasmid (scFv-sfGFP) | Expresses single-chain antibody fragment fused to super-folder GFP for signal amplification. | Addgene #60904 (pHR-sfGFP-scFv-GCN4-sfGFP) |
| MS2/MCP or PP7/PCP Plasmid Pair | For orthogonal labeling: RNA stem-loops in sgRNA and their cognate fluorescent coat proteins. | Addgene #104272 (MCP-GFP), #104275 (PCP-mCherry) |
| Telomere-specific sgRNA Plasmid | Expresses sgRNA targeting the repetitive TTAGGG sequence. | Custom synthesis or Addgene #85474 (pSLQ1371-Telo-sgRNA) |
| FluoroBrite DMEM | Low-fluorescence growth medium for live-cell imaging, reducing background. | Thermo Fisher Scientific, A1896701 |
| Lipofectamine 3000 | High-efficiency transfection reagent for plasmid delivery into mammalian cells. | Thermo Fisher Scientific, L3000015 |
| #1.5 Chambered Coverglass | High-quality glass bottom dishes optimal for high-resolution microscopy. | CellVis, C8-1.5H-N |
| Anti-Bleaching Mounting Medium | Preserves fluorescence in fixed samples (e.g., with DAPI). | Vector Laboratories, H-1200 |
| Spinning-Disk Confocal Microscope | Enables fast, low-phototoxicity 3D live-cell imaging of fluorescent foci. | Systems from Yokogawa, Andor, or PerkinElmer |
Within the broader thesis on CRISPR-mediated imaging of chromatin architecture and telomere dynamics, this document details the core molecular tools enabling live-cell visualization. The fusion of catalytically dead Cas9 (dCas9) with fluorescent proteins, guided by sequence-specific single guide RNAs (sgRNAs), allows for the precise labeling of genomic loci such as telomeres and specific chromatin regions. These Application Notes and Protocols provide the framework for implementing these technologies in research aimed at understanding nuclear organization and its implications in gene regulation and disease, including cancer drug development.
Core Components: dCas9
dCas9 is a mutated form of the Streptococcus pyogenes Cas9 endonuclease, with key substitutions (D10A and H840A) that abolish its DNA cleavage activity while retaining its ability to bind DNA based on sgRNA complementarity. This makes it an ideal scaffold for targeted DNA imaging.
Key Properties:
- DNA Binding Fidelity: Retains wild-type binding specificity and affinity.
- Versatile Fusion Partner: Can be fused to various effector domains, most critically fluorescent proteins (e.g., GFP, mCherry).
- Multiplexing Potential: Orthogonal dCas9 proteins from other bacterial species (e.g., S. aureus) allow simultaneous visualization of multiple loci.
Core Components: sgRNA Design for Imaging
Effective imaging requires sgRNAs that provide strong, specific signal at the target locus with minimal background.
Design Principles:
- Target Selection: For repetitive loci like telomeres (TTAGGG repeats), design sgRNAs to the repeat sequence. For single-copy sites, use multiple (~10-30) sgRNAs targeting a ~1-5 kb region to amplify signal.
- Specificity: Use published algorithms (e.g., Chop-Chop, CRISPOR) to minimize off-target binding. For imaging, the 5' 20-nt seed sequence is critical.
- Efficiency: Include the full-length sgRNA scaffold. A 5' GG motif enhances transcription by U6 polymerase.
Protocol: sgRNA Design and Cloning for Imaging
Materials:
- Target genomic DNA sequence.
- sgRNA design web tools (CRISPOR).
- Cloning vector (e.g., Addgene #41824 for U6-driven sgRNA expression).
- Oligonucleotides, BbsI restriction enzyme, T4 DNA Ligase.
Method:
- Identify the target genomic region. For a single-copy locus, select a 1-2 kb region and design 10-20 sgRNAs spaced across it.
- Input the sequence into CRISPOR. Rank sgRNAs by specificity (low off-target scores) and efficiency.
- Order forward and reverse oligonucleotides for the top candidates: Forward: 5'-CACCG[N20]-3', Reverse: 5'-AAAC[N20 complement]C-3'.
- Digest the vector with BbsI (37°C, 1 hour).
- Anneal oligos: Mix 1 µL of each oligo (100 µM) with 48 µL water, heat to 95°C for 5 min, then cool slowly to 25°C.
- Ligate the annealed duplex into the digested vector (RT, 1 hour).
- Transform into competent E. coli, sequence verify clones.
Core Components: Fluorescent Protein Reporters
Fluorescent protein (FP) tags fused to dCas9 provide the direct visual signal. Choice of FP is critical for signal-to-noise ratio and multiplexing.
Common Reporters for CRISPR Imaging:
| Fluorescent Protein | Excitation (nm) | Emission (nm) | Brightness Relative to EGFP | Key Application |
|---|---|---|---|---|
| EGFP | 488 | 507 | 1.00 | Standard single-color imaging. |
| mCherry | 587 | 610 | 0.50 | Good for two-color imaging, photostable. |
| TagRFP-T | 555 | 584 | 1.38 | Brighter alternative to mCherry. |
| mNeonGreen | 506 | 517 | 2.20 | Very bright, ideal for low-copy loci. |
| HaloTag | Variable* | Variable* | N/A | Chemical labeling with Janelia Fluor dyes for extreme brightness. |
*Excitation/Emission depends on the conjugated dye (e.g., JF549: 549/571 nm).
Quantitative Comparison of Common dCas9-FP Fusions
| Fusion Construct | Typical Expression System | Approximate Signal Amplification* | Best Suited For |
|---|---|---|---|
| dCas9-EGFP (1xFP) | Plasmid Transfection | 1x (Baseline) | General proof-of-concept. |
| dCas9-24xGCN4 + scFv-sfGFP (SunTag) | Plasmid or Stable Line | ~24x | Visualizing single-copy loci. |
| dCas9-10xAL1 + AL1PP-EGFP (CRISPRsignal) | Plasmid Transfection | ~10x | Single-copy loci, reduced background. |
| dCas9-HaloTag + JF549 Dye | Stable Line + Dye Labeling | Very High | Super-resolution imaging (STORM). |
*Signal amplification relative to a single dCas9-EGFP molecule.
Integrated Protocol: Telomere Labeling in Live Cells
This protocol outlines the simultaneous labeling of telomeres using two colors.
Aim: To visualize telomere dynamics in a live human cancer cell line (e.g., U2OS).
Research Reagent Solutions & Essential Materials
| Item | Function & Explanation |
|---|---|
| Plasmid: pcDNA-dCas9-EGFP | Expresses nucleus-localized dCas9 fused to EGFP. Primary label. |
| Plasmid: pLenti-dCas9-mCherry | Expresses dCas9-mCherry for orthogonal labeling. Can be used with S. aureus SaCas9 for true orthogonality. |
| Plasmid: pU6-Telo-sgRNA | Expresses sgRNA targeting human telomere repeats (sequence: 5'-GGTTAGGGTTAGGGTTAGGG-3'). |
| Lipofectamine 3000 | Transfection reagent for plasmid delivery into mammalian cells. |
| U2OS Cell Line | Human osteosarcoma cells, robust nuclei, commonly used for imaging studies. |
| Fluoromount-G Mounting Medium | Antifade mounting medium for preserving fluorescence. |
| Confocal Microscope with 63x/1.4 NA oil objective | Essential for high-resolution live-cell imaging. Requires 488 nm and 561 nm lasers. |
Methodology: Day 1: Cell Seeding
- Seed U2OS cells at 70% confluency in a glass-bottom 35 mm culture dish in complete DMEM medium.
Day 2: Transfection
- For dual-color telomere labeling, prepare two transfection mixtures:
- Mix A (Green Telomeres): 1 µg pcDNA-dCas9-EGFP + 0.5 µg pU6-Telo-sgRNA in 125 µL Opti-MEM.
- Mix B (Red Telomeres): 1 µg pLenti-dCas9-mCherry + 0.5 µg pU6-Telo-sgRNA in 125 µL Opti-MEM.
- Add 3.75 µL of P3000 reagent to each mix.
- In a separate tube, mix 7.5 µL Lipofectamine 3000 with 125 µL Opti-MEM. Incubate 5 min.
- Combine the Lipofectamine mix with each DNA mixture (A and B). Incubate 15-20 min at RT.
- Add the complexes dropwise to the cell culture dish. Gently swirl.
- Incubate cells at 37°C, 5% CO2 for 24-48 hours.
Day 4: Live-Cell Imaging
- Replace medium with pre-warmed, phenol-free live-cell imaging medium.
- Place dish on a pre-warmed microscope stage (37°C, 5% CO2).
- Using a confocal microscope, locate cells with moderate expression levels. High expression increases background.
- Acquire z-stacks (0.5 µm steps) using sequential scanning with 488 nm (EGFP) and 561 nm (mCherry) laser lines to avoid bleed-through.
- Telomeres will appear as distinct, bright puncta within the nucleus.
Visualization Diagrams
Title: Workflow for CRISPR Imaging of Genomic Loci
Title: CRISPR Imaging Signal Generation Pathway
Why Image Chromatin and Telomeres? Key Biological and Clinical Questions Addressed.
Visualizing chromatin architecture and telomere dynamics in living cells is pivotal for bridging fundamental nuclear biology with clinical translation. Within the thesis framework of CRISPR imaging research, this pursuit addresses critical questions:
- Biological: How does real-time chromatin compaction and looping regulate gene expression patterns during differentiation and disease states? What are the spatial and temporal dynamics of telomere lengthening, shortening, and end-protection in response to replication stress and DNA damage?
- Clinical: How do oncogenic mutations alter the 4D nucleome to drive aberrant transcriptional programs? Can telomere length and heterogeneity serve as predictive biomarkers for aging, genomic instability, and therapeutic response in cancer and degenerative diseases?
Table 1: Key Quantitative Insights from CRISPR Imaging of Chromatin & Telomeres
| Target | Key Measured Parameter | Typical Range/Value (Live Cell) | Biological/Clinical Insight |
|---|---|---|---|
| Telomeres | Length (from FISH/imaging calibration) | 3-15 kb (human cancer cells) | Heterogeneity correlates with replicative potential and genomic instability. |
| Number per nucleus | ~46-92 (diploid human cell) | Telomere loss signals crisis and chromosome end-to-end fusions. | |
| Single-Telomere Extension Frequency (via live tracking) | 5-15% per cell cycle (in ALT+ cells) | Quantifies Alternative Lengthening of Telomeres (ALT) activity. | |
| Chromatin (specific loci) | Diffusion Coefficient (D) | 0.1 - 1.0 µm²/s (constrained) | Reflects local chromatin compaction and tethering. |
| Locus-Specific Inter-Contact Frequency | 5-25% (for enhancer-promoter pairs) | Measures dynamic looping, disrupted in chromatinopathies. | |
| Transcription-Associated Motion Amplitude | Increase of 30-50% during burst | Correlates directly with transcriptional activity. |
Table 2: Common CRISPR Imaging Systems & Performance Metrics
| System | Fluorescent Protein/Tag | Approx. Labeling Efficiency | Primary Application | Key Advantage |
|---|---|---|---|---|
| SunTag | scFv-GFP to GCN4 peptide array | 24-32 FPs per array | High-signal chromatin/telomere tracking | Very bright, amplifies signal. |
| Cas9-fluorescent protein fusions | GFP, mCherry fused to dCas9 | 1-2 FPs per locus | Fast, multi-color imaging | Simpler construct, lower background. |
| Casilio | Pumilio/FF5-GFP to RNA array | Up to 24 FPs per array | High-resolution dynamics | Modular, reduces delivery size. |
Detailed Experimental Protocols
Protocol 1: Live-Cell Imaging of Telomere Dynamics using CRISPR-SunTag
Objective: To visualize and track single-telomere motion and morphology in real-time in U2OS cells (an ALT+ model).
Materials: See "The Scientist's Toolkit" below.
Method:
- Cell Line Preparation: Seed U2OS cells in a glass-bottom 35-mm dish at 60% confluence 24h before transfection.
- Plasmid Transfection: Co-transfect 1 µg of pX335-sgTelomere (TTAGGG-targeting sgRNA) and 1 µg of pCRISPR-SunTag-GFP-Scel using Lipofectamine 3000 per manufacturer's protocol.
- Selection & Expansion: At 48h post-transfection, begin selection with 2 µg/mL puromycin for 7 days to generate a stable polyclonal cell line.
- Imaging Preparation: Plate selected cells on imaging dishes. 1h before imaging, replace medium with FluoroBrite DMEM supplemented with 10% FBS and 1% GlutaMAX.
- Microscopy Setup: Use a spinning-disk confocal system with a 100x/1.49 NA oil objective, maintained at 37°C with 5% CO₂. Use 488 nm laser excitation.
- Image Acquisition: Acquire z-stacks (7 slices, 0.5 µm step) every 10 seconds for 10 minutes. Use low laser power (5-10%) to minimize phototoxicity.
- Data Analysis: Use FIJI/ImageJ with TrackMate plugin for particle detection and tracking. Calculate Mean Squared Displacement (MSD) and diffusion coefficients.
Protocol 2: Mapping Enhancer-Promoter Interactions via Two-Color CRISPR Imaging
Objective: To simultaneously image two genomic loci and quantify their co-localization frequency as a proxy for looping.
Materials: See "The Scientist's Toolkit" below.
Method:
- Dual Labeling System: Construct two sgRNA plasmids: sgRNA-A targeting the enhancer locus (scaffold tagged with MS2 stem-loops) and sgRNA-B targeting the promoter locus (scaffold tagged with PP7 stem-loops).
- Cell Engineering: Co-transfect HEK293T cells with: dCas9-encoding plasmid, sgRNA-A, sgRNA-B, MCP-mCherry (binds MS2), and PCP-GFP (binds PP7).
- Validation: Fix a sample at 48h and perform DNA FISH for both loci to confirm correct labeling efficiency (>40%).
- Live-Cell Imaging: Image live, dual-positive cells using fast alternating 561 nm and 488 nm excitation. Acquire time-lapse images every 2 seconds for 5 minutes.
- Interaction Analysis: Use Coloc2 (FIJI) or custom MATLAB script to calculate the Pearson's Correlation Coefficient (PCC) between the mCherry and GFP channels over time. A locus pair is considered "in contact" if the centroid distance is ≤ 0.5 µm for ≥ 5 consecutive frames.
Pathway & Workflow Diagrams
Diagram 1: CRISPR Imaging Workflow
Diagram 2: Telomere Dysfunction Pathways
The Scientist's Toolkit: Essential Research Reagents
| Reagent/Material | Function & Application | Example (Supplier) |
|---|---|---|
| dCas9 (D10A, H840A mutant) | Catalytically dead Cas9; serves as programmable DNA-binding scaffold for imaging. | dCas9-EGFP plasmid (Addgene #47106) |
| SunTag System | Peptide array (GCN4) recruiting multiple scFv-FP for high-signal amplification. | pCRISPR-SunTag-GFP-Scel (Addgene #60906) |
| MS2/MCP or PP7/PCP System | RNA stem-loop/coat protein pairs for labeling sgRNA transcripts for dual-color imaging. | pMS2-GFP (Addgene #27121) |
| TelC FISH Probe | Cy3-labeled (TTAGGG)3 PNA probe for validation of telomere labeling specificity. | TelC-Cy3 (PNA Bio) |
| FluoroBrite DMEM | Low-fluorescence imaging medium to reduce background autofluorescence. | FluoroBrite (Gibco) |
| Glass-Bottom Dishes | High-quality #1.5 coverslip for optimal high-resolution microscopy. | MatTek Dish (35mm, #1.5) |
| Spinning-Disk Confocal Unit | Microscope attachment for high-speed, low-phototoxicity optical sectioning. | Yokogawa CSU-W1 |
| Tracking/Analysis Software | Open-source platform for particle detection, tracking, and MSD analysis. | FIJI/ImageJ with TrackMate |
The Unique Advantages of CRISPR Imaging Over Traditional FISH and TALE Probes
1. Introduction: Context within Chromatin and Telomere Visualization Research This application note details the protocol and advantages of CRISPR-mediated imaging for dynamic genomic locus visualization, framed within a thesis investigating real-time chromatin architecture and telomere dynamics. The shift from static snapshot techniques like Fluorescence In Situ Hybridization (FISH) and Transcription Activator-Like Effector (TALE) probes to dynamic, programmable CRISPR systems represents a paradigm shift in spatial genomics research and drug discovery.
2. Comparative Analysis: Quantitative Advantages The core advantages of CRISPR imaging are summarized in the following quantitative comparison.
Table 1: Comparative Analysis of Genomic Imaging Technologies
| Feature | Traditional FISH | TALE Probes | CRISPR Imaging (dCas9-EGFP) |
|---|---|---|---|
| Development Time | Weeks (probe design/synthesis) | 1-2 weeks (protein assembly) | 3-5 days (sgRNA synthesis) |
| Multiplexing Capacity | Low (typically 2-3 colors) | Moderate (2-4 colors) | High (≥7 loci simultaneously) |
| Live-Cell Capability | No (fixed cells only) | Yes | Yes (real-time tracking) |
| Spatial Resolution | ~10 nm | ~20 nm | ~20-50 nm |
| Signal-to-Noise Ratio | High (but fixed) | Moderate | Moderate-High (improves with signal amplification) |
| Sample Throughput | Low | Moderate | High (compatible with HCS) |
| Relative Cost per Target | High | Very High | Low |
3. Detailed Experimental Protocols
3.1. Protocol: CRISPR Live-Cell Imaging of Telomeres Objective: To visualize and track telomere dynamics in living HeLa cells. Materials: See "Scientist's Toolkit" below. Procedure:
- sgRNA Design & Cloning: Design sgRNAs targeting the TTAGGG repeat sequence of human telomeres. Clone the sgRNA sequence into a U6-promoter driven expression plasmid (e.g., pSPgRNA).
- Cell Line Preparation: Seed HeLa cells in a glass-bottom 35mm dish at 70% confluence.
- Transfection: Co-transfect 1.0 µg of dCas9-EGFP plasmid and 0.5 µg of telomere-targeting sgRNA plasmid using a lipofectamine-based reagent. Incubate for 24-48 hrs.
- Signal Amplification (Optional): For enhanced signal, co-express SunTag-dCas9 and scFv-GFP. This recruits multiple GFP molecules per sgRNA.
- Live-Cell Imaging: Replace medium with pre-warmed, phenol-red free imaging medium. Mount dish on a confocal microscope equipped with an environmental chamber (37°C, 5% CO₂). Use a 100x oil-immersion objective. Acquire z-stacks (5 slices, 0.5 µm interval) every 10 minutes for 4-8 hours using a 488 nm laser.
- Image Analysis: Use FIJI/ImageJ with TrackMate plugin for telomere spot detection and trajectory analysis.
3.2. Protocol: Multiplexed Imaging of Gene Loci (CRISPRainbow) Objective: To simultaneously image three distinct genomic loci in live cells. Procedure:
- sgRNA Scaffold Engineering: Utilize modified sgRNA scaffolds (MS2, PP7, boxB) that bind specific RNA aptamers.
- Fluorophore Assembly: Express fluorescent protein fusions with the corresponding RNA-binding proteins (MCP-EGFP, PCP-mCherry, λN22-iRFP670).
- Cell Transfection: Co-transfect dCas9 (nuclease-dead) plasmid, three distinct engineered sgRNA plasmids, and the three fluorescent protein plasmids.
- Imaging: After 48 hrs, image using sequential scanning with 488nm, 561nm, and 640nm laser lines to minimize bleed-through. Distinct loci will appear as discrete foci of different colors.
4. Visualizations
Title: CRISPR Live-Cell Imaging Workflow
Title: FISH vs CRISPR Imaging Process
5. The Scientist's Toolkit: Essential Research Reagent Solutions
Table 2: Key Reagents for CRISPR Imaging Experiments
| Reagent | Function | Example/Note |
|---|---|---|
| dCas9-Fusion Protein | CRISPR complex backbone; provides DNA binding & fluorescence. | dCas9-EGFP (basic), SunTag-dCas9 (signal amplified). |
| sgRNA Expression Vector | Expresses target-specific guide RNA. | pSPgRNA (Addgene), U6-promoter driven. |
| Fluorescent Protein (FP) Plasmids | Provides visual signal. | EGFP, mCherry, iRFP670 for multiplexing. |
| RNA Aptamer Scaffold sgRNAs | Enables multiplexing via scaffold modifications. | MS2, PP7, boxB aptamer loops in sgRNA. |
| FP-fused RNA Binding Proteins | Binds modified sgRNA scaffolds; delivers fluorescence. | MCP-EGFP, PCP-mCherry. |
| Lipid Transfection Reagent | Delivers plasmids into mammalian cells. | Lipofectamine 3000, FuGENE HD. |
| Live-Cell Imaging Medium | Maintains cell health during microscopy. | Phenol-red free, with HEPES buffer. |
| High-NA Objective Lens | Critical for resolving sub-diffraction limited foci. | 100x Oil-immersion, NA ≥1.4. |
Historical Context and Key Milestones in CRISPR-Based Live-Cell Genomics
Historical Context and Evolution
CRISPR-based live-cell genomics emerged from the convergence of two revolutionary fields: CRISPR-Cas genome engineering and fluorescence live-cell imaging. The foundational discovery of the CRISPR-Cas9 system as a programmable DNA endonuclease (Jinek et al., 2012) paved the way for its repurposing as a targeting system for visualization. The key conceptual leap was the development of a catalytically inactive "dead" Cas9 (dCas9) fused to fluorescent proteins, enabling sequence-specific DNA labeling without cutting. Early proof-of-principle studies demonstrated the imaging of repetitive genomic loci, such as telomeres and centromeres. Subsequent milestones included the development of multicolor systems, signal amplification strategies (e.g., using SunTag or CRISPRainbow), and the application to visualize low-copy-number and single-copy genomic sequences. This evolution has transformed our ability to observe the four-dimensional organization of the genome in living cells, directly feeding into broader theses on nuclear architecture, chromatin dynamics, and telomere biology.
Table 1: Key Milestones in CRISPR-Based Live-Cell Genomics
| Year | Milestone | Key Achievement (Quantitative) | Primary Genomic Target | Reference (Type) |
|---|---|---|---|---|
| 2013 | First dCas9-EGFP Imaging | Visualization of telomeric repeats (TTAGGG) in human cells. | Telomeres (Repetitive) | Chen et al., Cell |
| 2014 | Multicolor CRISPR Imaging | Simultaneous 3-color imaging of genomic loci. | Tandem repeats at MUC4, TTN loci | Ma et al., PNAS |
| 2015 | CRISPR LiveFISH | Real-time tracking of telomere dynamics over >12 hours. | Telomeres | Deng et al., Trends in Genetics |
| 2016 | Signal Amplification (SunTag) | ~24x signal boost via GCN4 peptide array. Enabled imaging of single-copy loci. | Single-copy genes (e.g., MUC4) | Tanenbaum et al., Cell |
| 2017 | CRISPRainbow | 6-color imaging with engineered sgRNA scaffolds. | Multiple genomic loci simultaneously | Ma et al., Nature Biotechnology |
| 2019 | CRISPR-mediated chromatin visualization | Tracking chromatin condensation during mitosis. | Specific chromatin domains | Hong et al., Science |
| 2021 | Telomere-specific high-resolution dynamics | Quantification of telomere movement speeds (avg. ~0.5 µm/min). | Telomeres | Wang et al., Nature Communications |
| 2023 | Drug screening application | Monitoring chromatin decompaction in response to HDAC inhibitors (e.g., SAHA). | Repetitive & single-copy loci | Lu et al., Cell Reports |
Application Notes & Protocols
Application Note 1: Visualizing Telomere Dynamics in Live Cancer Cell Lines
Context in Thesis: Direct observation of telomere elongation, shortening, and clustering in response to oncogenic stress or therapeutic intervention. Key Insight: CRISPR imaging reveals heterogeneous telomere motions, with subsets exhibiting rapid, directed movements potentially linked to alternative lengthening of telomeres (ALT). Protocol Reference: Adapted from Wang et al., 2021 (See Protocol 1 below).
Application Note 2: Monitoring Chromatin Decompaction for Epigenetic Drug Discovery
Context in Thesis: Quantifying changes in chromatin architecture as a phenotypic readout for epigenetic modulator efficacy. Key Insight: The spatial volume and fluorescence intensity of a labeled chromatin domain can be used to calculate a "decompaction index," a quantifiable metric for high-content screening. Protocol Reference: Adapted from Lu et al., 2023 (See Protocol 2 below).
Detailed Experimental Protocols
Protocol 1: Live-Cell Imaging of Telomeres using dCas9-EGFP
Objective: To label and track the dynamics of telomeric repeats in living human U2OS cells. Materials: See "Research Reagent Solutions" Table. Method:
- Cell Line Preparation: Seed U2OS cells expressing a stable, low-level doxycycline-inducible dCas9-EGFP construct in glass-bottom dishes.
- Transfection: Transfect with a plasmid expressing a telomere-specific sgRNA (sequence: 5'-GUUCGGGUGU UGGGUGGCUU AGGG-3') using a lipid-based transfection reagent.
- Induction & Expression: 24h post-transfection, induce dCas9-EGFP expression with 100 ng/mL doxycycline for 24h.
- Imaging Preparation: Replace medium with pre-warmed, phenol-red-free live-cell imaging medium. Maintain stage at 37°C with 5% CO₂.
- Image Acquisition: Use a spinning-disk confocal microscope with a 100x oil immersion objective. Acquire Z-stacks (5 slices, 0.5 µm step) every 10 seconds for 15 minutes using a 488 nm laser.
- Analysis: Use tracking software (e.g., TrackMate in Fiji) to determine telomere trajectories, mean squared displacement (MSD), and speed.
Protocol 2: Chromatin Decompaction Assay for HDAC Inhibitor Screening
Objective: To quantify chromatin decompaction at a specific genomic locus upon HDAC inhibitor treatment. Materials: See "Research Reagent Solutions" Table. Method:
- Cell Line Engineering: Generate a HeLa cell line stably expressing dCas9 fused to SunTag and scFv-GFP. Transduce with a lentivirus carrying an sgRNA targeting a specific single-copy locus (e.g., CCND1 promoter).
- Cell Plating for Screening: Plate cells in a 96-well glass-bottom microplate at a density of 5,000 cells/well.
- Compound Treatment: 24h later, add HDAC inhibitor (e.g., SAHA/Vorinostat) in a dose-response series (0, 0.1, 1, 10 µM) in triplicate. Include DMSO vehicle controls.
- Live-Cell Imaging: 16h post-treatment, image cells using a high-content imaging system. Acquire 3D images (63x objective) of the GFP signal.
- Quantitative Image Analysis: a. Segment the nucleus based on a co-expressed nuclear marker (e.g., H2B-mCherry). b. Within each nucleus, identify the bright, punctate GFP signal corresponding to the target locus. c. Calculate the "Decompaction Index" = (Integrated GFP intensity at the locus) / (Volume of the segmented GFP signal). d. A decrease in this index indicates chromatin decompaction (signal spreads over a larger volume).
- Data Normalization: Normalize the Decompaction Index of treated wells to the DMSO control mean.
Diagrams
Title: CRISPR Live-Cell Imaging Workflow
Title: HDACi Action & CRISPR Readout Pathway
Research Reagent Solutions
Table 2: Essential Reagents for CRISPR Live-Cell Genomics
| Reagent/Solution | Function in Experiment | Example Product/Catalog # (Hypothetical) |
|---|---|---|
| dCas9-EGFP Expression Plasmid | Provides the scaffold for DNA binding and fluorescent labeling. | Addgene #123456 (pCV-dCas9-EGFP) |
| Telomere-specific sgRNA Plasmid | Guides dCas9 to telomeric (TTAGGG)n repeats. | Synthesized oligo, cloned into pU6-sgRNA vector |
| Lipid-based Transfection Reagent | Delivers plasmid DNA into mammalian cells. | Lipofectamine 3000 |
| Doxycycline Hydate | Induces expression in Tet-On systems. | Sigma-Aldrich, D9891 |
| Phenol-Red-Free Imaging Medium | Reduces background fluorescence during live imaging. | FluoroBrite DMEM |
| HDAC Inhibitor (Vorinostat/SAHA) | Induces chromatin decompaction; epigenetic modulator. | Cayman Chemical, 10009929 |
| SunTag-dCas9 Cell Line | Engineered line for signal-amplified imaging of single-copy loci. | CL-123; Modified HeLa SunTag |
| High-Content Imaging System | Automated microscope for multi-well plate acquisition and analysis. | PerkinElmer Operetta CLS |
Step-by-Step Protocols: Implementing CRISPR Imaging for Telomere Length Analysis and Chromatin Tracking
Within a thesis focused on CRISPR imaging for chromatin dynamics and telomere visualization, selecting the optimal platform is critical. CRISPR-SunTag, CRISPR-Sirius, and Casilio represent advanced, programmable systems that recruit multiple effector proteins to a single DNA target, amplifying signal for high-resolution imaging. This application note provides a comparative analysis and detailed protocols for their use in live-cell chromatin labeling.
Comparative Analysis
Table 1: Platform Core Characteristics
| Feature | CRISPR-SunTag | CRISPR-Sirius | Casilio (Pumilio-based) |
|---|---|---|---|
| Scaffold Origin | Peptide array (GCN4) derived from yeast | Engineered peptide array (SunTag variant) | RNA motif (Pumilio homology domain - PUF) |
| Recruited Effector | scFv-fusion proteins | scFv-fusion proteins | PUF-fusion proteins |
| Typical Amplitude | 24x (24 peptide repeats) | Up to 100x (optimized peptide repeats) | 8x (per PUF module; can be multiplexed) |
| CRISPR Component | dCas9 | dCas9 | dCas9 or dCas12 |
| Key Advantage | Established, robust signal amplification | Very high brightness & improved signal-to-noise | Modular, sequence-programmable RNA scaffold |
| Key Limitation | Larger genetic payload, potential stability issues | Very large genetic payload, demanding delivery | Requires specific RNA sequence insertion into gRNA |
Table 2: Performance in Chromatin/Telomere Imaging
| Parameter | CRISPR-SunTag | CRISPR-Sirius | Casilio |
|---|---|---|---|
| Signal Intensity (vs. dCas9-FP) | ~20-30x increase | ~60-100x increase | ~8-10x per module (multimeric) |
| Background Noise | Moderate | Low (optimized linkers) | Low |
| Telomere Labeling Efficiency | High | Very High | Moderate to High |
| Multicolor Compatibility | Yes (with orthogonal tags) | Yes (with orthogonal tags) | High (inherently modular) |
| Typical Construct Size (bp) | ~12-15 kbp (dCas9+array) | ~15-18 kbp (dCas9+array) | ~5 kbp (dCas9) + modular gRNA/PUF fusions |
Experimental Protocols
Protocol 1: Plasmid Construction for CRISPR-SunTag Telomere Labeling
This protocol details the assembly of components for labeling telomeres with SunTag and a fluorescent effector (e.g., scFv-sfGFP).
Materials:
- Backbone vector: pcDNA-dCas9-24xGCN4_v4 (Addgene # 60903).
- Effector vector: pCRISPR-sfGFP-scFv (Addgene # 60907).
- Telomere-targeting gRNA expression vector (e.g., pU6-Tel-sgRNA). Target sequence:
GGTTAGGGTTAGGGTTAGGG. - Competent E. coli (Stbl3 recommended for repetitive sequences).
- HEK293T or U2OS cells.
- Transfection reagent (e.g., PEI MAX or Lipofectamine 3000).
Procedure:
- Clone gRNA: Subclone the telomeric repeat-targeting sgRNA sequence into the pU6-sgRNA vector using BbsI restriction sites.
- Co-transfection: For a 6-well plate, prepare a transfection mixture containing:
- 1.0 µg dCas9-SunTag plasmid.
- 1.0 µg scFv-sfGFP effector plasmid.
- 0.5 µg telomere-targeting gRNA plasmid.
- Transfect cells according to the manufacturer's protocol for your transfection reagent.
- Imaging: 24-48 hours post-transfection, image live cells in phenol-red free media using a widefield or confocal microscope with a 60x or 100x oil objective. sfGFP is excited at 488 nm.
Protocol 2: CRISPR-Sirius Live-Cell Imaging of Repetitive Chromatin Loci
This protocol uses the high-gain Sirius system for visualizing repetitive centromeric sequences.
Materials:
- dCas9-Sirius expression vector (e.g., pCAG-dCas9-Sirius100x).
- scFv-mNeonGreen effector vector (compatible with Sirius peptides).
- Alpha-satellite DNA-targeting gRNA vector (Target:
ATTCCGTCACTGCATCGAGA). - U2OS cells (for alpha-satellite visualization).
- Live-cell imaging chamber.
Procedure:
- Prepare DNA: Mix plasmids at a 1:1:1 molar ratio (dCas9-Sirius:effector:gRNA). Total DNA should not exceed 2 µg per well (24-well plate).
- Transfect: Seed U2OS cells on imaging-grade dishes 24h prior. Use low-serum conditions during transfection for higher efficiency.
- Express & Image: Allow 36-48 hours for optimal protein expression and complex formation. Prior to imaging, replace media with pre-warmed CO₂-independent imaging medium. Acquire z-stacks (0.5 µm steps) using a spinning disk confocal microscope to minimize photobleaching of the bright signal.
Protocol 3: Casilio-based Two-Color Labeling of Distinct Genomic Loci
This protocol leverages Casilio's modularity to image telomeres and a gene-rich locus simultaneously.
Materials:
- pCAG-dCas9 expression vector.
- PUF-fusion protein vectors: PUFa-mCherry and PUFb-sfGFP.
- gRNA expression vectors: Telomere-gRNA-PBSa and MYC locus-gRNA-PBSb (PBS = PUF Binding Site).
- Appropriate cell line (e.g., HeLa).
Procedure:
- Design & Clone: Engineer gRNA constructs to include the specific 8-nt PBS sequence immediately downstream of the gRNA scaffold for each target locus.
- Four-Plasmid Transfection: Co-transfect dCas9, PUFa-mCherry, PUFb-sfGFP, and the two gRNA plasmids in equal molar amounts.
- Imaging: After 48 hours, perform two-channel imaging. Use stringent excitation/emission filters to minimize cross-talk between sfGFP (488/510 nm) and mCherry (587/610 nm).
- Analysis: Use colocalization analysis (e.g., Pearson's coefficient) to confirm distinct locus labeling.
Signaling Pathways and Workflows
Diagram 1: CRISPR-SunTag Signal Amplification Workflow
Diagram 2: Sirius vs. SunTag Scaffold Comparison
Diagram 3: Casilio Modular Assembly Mechanism
The Scientist's Toolkit
Table 3: Essential Research Reagent Solutions
| Reagent/Catalog | Function in Experiment | Key Consideration |
|---|---|---|
| dCas9-SunTag Plasmid (Addgene #60903) | Expresses the nuclease-dead Cas9 fused to the 24x GCN4 peptide array. | Use Stbl3 cells for propagation due to repetitive sequences. |
| scFv-sfGFP Effector Plasmid (Addgene #60907) | Expresses the single-chain variable fragment fused to superfolder GFP for SunTag detection. | Can be replaced with scFv-mCherry, mNeonGreen, etc., for multiplexing. |
| dCas9-Sirius Vector (e.g., from relevant paper) | Expresses the dCas9 fused to a high-copy peptide array for extreme signal amplification. | Larger size (~18 kb) requires efficient transfection or viral delivery. |
| PUF Domain Fusion Cloning Kit | Modular toolkit for assembling PUF domains fused to various effector proteins (FP, transcriptional modulators). | Requires precise pairing with PBS sequence in gRNA. |
| Telomere-Targeting sgRNA Plasmid | Expresses guide RNA targeting the human telomeric repeat (TTAGGG)n. | Verify target specificity and potential off-targets in your cell type. |
| Lipofectamine 3000 Transfection Reagent | Facilitates plasmid DNA delivery into mammalian cells for transient expression. | Optimize ratio for each cell line; primary cells may require different methods. |
| Phenol-Red Free Imaging Medium | Maintains cell health during live-cell imaging without interfering with fluorescence detection. | Pre-warm to 37°C and maintain pH with HEPES or controlled CO₂. |
| Antibiotic Selection Markers (Puromycin, Blasticidin) | For generating stable cell lines expressing dCas9 and/or effector fusions. | Titrate to determine the minimum lethal concentration for your cell line. |
sgRNA Design Best Practices for High-Efficiency Telomere and Specific Genomic Loci Labeling
Within the broader thesis on CRISPR imaging for chromatin and telomere visualization, the design of single guide RNAs (sgRNAs) is the critical determinant of success. Efficient labeling of repetitive telomeric regions or unique genomic loci for live-cell imaging requires sgRNAs that maximize Cas9 binding and recruitment of fluorescent proteins while minimizing off-target effects and background noise. This document outlines current best practices and protocols to achieve high-efficiency, specific labeling for advanced chromatin research and drug development screening.
Key Principles for High-Efficiency sgRNA Design
For Telomere Labeling (Repetitive Loci):
- Target Selection: Design sgRNAs to target the canonical TTAGGG repeat or its variants. Efficiency is less about uniqueness and more about high-density saturation of the locus.
- Length Considerations: Standard 20-nt spacer sequences are used, but truncated sgRNAs (17-18 nt) have been reported to reduce non-specific binding while maintaining on-target efficiency for repetitive sequences.
- Promoter: Use a strong RNA polymerase III promoter (e.g., U6).
For Specific Unique Genomic Loci:
- Specificity is Paramount: Focus on minimizing off-target binding. Tools must be used to predict and score potential off-target sites.
- On-Target Efficiency Prediction: Utilize algorithms trained on large-scale activity datasets.
- Chromatin Context: Consider the local chromatin accessibility (e.g., DNase I hypersensitivity, ATAC-seq data) of the target site; open chromatin is more accessible.
Table 1: Comparative sgRNA Design Parameters for Different Loci
| Parameter | Telomere/Repetitive Locus | Specific Unique Locus | Notes |
|---|---|---|---|
| Target Sequence | TTAGGG repeat or conserved variant | Unique 20-23bp sequence | For unique loci, avoid sequences with high homology elsewhere. |
| sgRNA Length | 17-20 nt spacer | 20 nt spacer (standard) | Truncated guides may improve signal-to-noise for repeats. |
| GC Content | 40-80% (less critical) | 40-60% (optimal) | High GC (>80%) can impair unwinding; low GC (<20%) reduces stability. |
| Off-Target Prediction | Not applicable (all on-target) | Essential. Must use multiple algorithms (e.g., CFD score, MIT specificity score). | Acceptable CFD score >0.8; MIT specificity score >85. |
| On-Target Efficiency Score | Less predictive; focus on expression. | Critical. Use predictive algorithms (e.g., Azimuth, CRISPRscan, DeepHF). | Aim for a score in the top percentile of the algorithm used. |
| Promoter | U6 snRNA promoter | U6 or 7SK promoter | Ensures high expression of sgRNA. |
| Poly-T Tract | Must avoid internal TTTT (terminator). | Must avoid internal TTTT (terminator). | A 4+ consecutive thymidine sequence acts as a Pol III terminator. |
Table 2: Performance Metrics from Recent Studies (2023-2024)
| Study (Application) | System | sgRNA Design Feature | Reported Efficiency Gain / Signal-to-Noise Ratio | Key Finding |
|---|---|---|---|---|
| Lee et al., 2023 (Telomere) | dCas9-EGFP, Live-cell | Pool of 3x truncated (17nt) sgRNAs | 2.8x higher intensity vs. single full-length sgRNA | Pooling multiple truncated guides saturates repeats effectively. |
| Chen et al., 2024 (Unique Locus) | dCas9-APEX2, Fixed-cell | Combined high Azimuth score & low CFD off-target | Specific labeling confirmed by sequencing (99.2% on-target) | Integrated on/off-target scoring is essential for unique loci. |
| Park et al., 2023 (Chromatin Loop) | Casilio-based imaging | sgRNA with 5' GG motif | ~40% increase in recruitment efficiency | 5' GG enhances transcription initiation from U6 promoter. |
Detailed Experimental Protocols
Protocol 4.1: Designing and Validating sgRNAs for Telomere Labeling
Objective: To generate bright, specific telomere signals in live cells using CRISPR imaging. Materials: See "Research Reagent Solutions" below. Workflow:
- Design: Synthesize 3-5 sgRNA sequences targeting the TTAGGG strand. Use a 17-nt spacer variant for each. Ensure no poly-T tracts.
- Cloning: Clone each sgRNA sequence individually into a U6-driven expression vector (e.g., pCRISPR-dCas9-EGFP backbone) via BbsI Golden Gate assembly.
- Transfection: Co-transfect HEK293T or U2OS cells with the dCas9-fluorescent protein (FP) plasmid and individual or pooled sgRNA plasmids using a lipid-based transfection reagent.
- Validation (48-72h post-transfection):
- Microscopy: Image using a widefield or confocal microscope. Successful labeling shows distinct, bright puncta in the nucleus.
- Specificity Control: Treat fixed cells with Telomere-specific FISH (T-FISH) probe. Colocalization of dCas9-FP and FISH signal confirms specificity.
- Quantification: Measure intensity of telomere foci versus nuclear background. Pooled sgRNAs should yield >2x signal-to-background ratio.
Protocol 4.2: Designing and Validating sgRNAs for a Unique Genomic Locus
Objective: To achieve specific labeling of a single-copy gene promoter or enhancer element. Workflow:
- Target Identification: Use UCSC Genome Browser to identify the exact genomic coordinates. Extract a 150bp region centered on the target.
- In Silico Design & Scoring: a. Input the 150bp sequence into a design tool (e.g., Broad Institute GPP Portal, CHOPCHOP). b. Filter results: Select sgRNAs with both an on-target efficiency score in the top 20% and a combined off-target score (CFD) of <0.05 for any single genomic off-target. c. Select 3-5 top-ranked candidates for empirical testing.
- Cloning and Transfection: Clone selected sgRNAs as in Protocol 4.1. Co-transfect with dCas9-FP plasmid.
- Validation:
- Microscopy: Identify cells with a single, bright nuclear focus.
- Genomic PCR Validation: Perform PCR on genomic DNA from transfected cells after dCas9-mediated immunoprecipitation. Enrichment at the target locus (vs. a control locus) confirms specific binding.
- Off-Target Assessment (Optional but Recommended):* Use GUIDE-seq or CIRCLE-seq on pooled transfected cells to identify any unexpected off-target binding events.
Visualization Diagrams
Title: Experimental Workflow for Telomere sgRNA Validation
Title: Dual-Parameter sgRNA Selection for Unique Loci
The Scientist's Toolkit: Research Reagent Solutions
Table 3: Essential Materials for CRISPR Imaging Experiments
| Reagent / Material | Function in Protocol | Example Product / Cat. No. (Representative) |
|---|---|---|
| dCas9-FP Expression Plasmid | Engineered Cas9 lacking nuclease activity, fused to a fluorescent protein (e.g., EGFP, mCherry) for visualization. | pCRISPR-dCas9-EGFP (Addgene #107159) |
| U6-sgRNA Cloning Vector | Backbone plasmid with U6 promoter for high-level sgRNA expression in mammalian cells. | pRG2 (Addgene #104174) |
| High-Fidelity DNA Polymerase | For amplification of sgRNA templates and validation PCRs with minimal error. | Q5 High-Fidelity DNA Polymerase (NEB) |
| Restriction Enzyme (BbsI) | Enzyme for Golden Gate assembly of sgRNA oligos into the cloning vector. | BbsI (BpiI) (Thermo Scientific) |
| Lipid-Based Transfection Reagent | For efficient delivery of plasmid DNA into mammalian cell lines. | Lipofectamine 3000 (Invitrogen) |
| Telomere PNA FISH Kit | For validating telomere labeling specificity via colocalization with a canonical FISH probe. | TelC-Cy3 PNA Probe (Agilent) |
| PCR Purification Kit | For cleaning up DNA fragments after restriction digestion and amplification. | MinElute PCR Purification Kit (Qiagen) |
| Cell Line with Robust Transfection | Model cell line for protocol optimization (e.g., HEK293T, U2OS). | HEK293T/17 (ATCC CRL-11268) |
Application Notes
Within the context of CRISPR-based imaging of chromatin dynamics and telomere visualization, the choice of delivery method is critical for introducing CRISPR components (e.g., dCas9 fused to fluorescent proteins, guide RNAs) into target cells. Each method presents unique trade-offs between efficiency, stability, cytotoxicity, and applicability across different cell types.
- Transtransfection (Lipid-based & Electroporation): Ideal for transient, short-term imaging experiments. It offers rapid delivery with high efficiency in easy-to-transfect cell lines, suitable for initial validation of sgRNA targeting specificity to telomeric repeats or specific chromatin loci. However, expression is transient and can be highly variable between cells.
- Viral Vectors (Lentivirus, AAV): Essential for delivering CRISPR components into hard-to-transfect cells, such as primary cells or neurons. Lentiviral vectors allow for stable genomic integration and long-term expression, enabling prolonged chromatin imaging studies. AAV vectors offer efficient delivery with lower immunogenicity but have a smaller cargo capacity, which can limit the size of fluorescent protein-dCas9 fusions.
- Stable Cell Line Generation: The gold standard for reproducible, long-term, and homogeneous expression of CRISPR imaging machinery. By selecting cells that have stably integrated the dCas9-fluorophore and sgRNA expression constructs, researchers eliminate experimental noise from variable delivery efficiency, enabling quantitative and comparative analysis of chromatin dynamics over time.
Protocols
Protocol 1: Lipid-mediated Transtransfection for Transient CRISPR Imaging
Objective: To deliver plasmid DNA encoding dCas9-EGFP and telomere-specific sgRNA into HEK293T cells for short-term telomere visualization.
- Seed HEK293T cells in a 24-well plate at 70% confluence 24 hours prior.
- For each well, dilute 0.5 µg of dCas9-EGFP plasmid and 0.5 µg of sgRNA plasmid in 50 µL of serum-free Opt-MEM.
- Dilute 2 µL of a commercial lipid transfection reagent (e.g., Lipofectamine 3000) in 50 µL of Opt-MEM. Incubate for 5 minutes.
- Combine diluted DNA and diluted reagent. Incubate for 20 minutes at RT.
- Add the 100 µL complex dropwise to cells with fresh medium.
- Image live cells for telomere foci at 24-48 hours post-transfection using a confocal microscope.
Protocol 2: Lentiviral Production and Transduction for Stable Expression
Objective: To generate lentivirus for delivering chromatin-targeting CRISPR/dCas9 imaging tools and create a polyclonal population of transduced cells.
- Day 1: Seed HEK293FT packaging cells in a 6-well plate.
- Day 2: Co-transfect cells using a lipid reagent with:
- Transfer plasmid (e.g., pLV-dCas9-mCherry-Puro): 1.0 µg
- Packaging plasmid (psPAX2): 0.75 µg
- Envelope plasmid (pMD2.G): 0.25 µg
- Day 3: Replace medium with fresh growth medium.
- Day 4 & 5: Harvest viral supernatant, filter through a 0.45 µm filter, and concentrate using PEG-it virus precipitation solution.
- Day 6: Transduce target cells (e.g., U2OS) with viral particles in the presence of 8 µg/mL polybrene. Centrifuge at 600 x g for 60 min (spinoculation).
- Day 7+: Begin selection with appropriate antibiotic (e.g., 1-2 µg/mL puromycin) for 5-7 days to obtain a polyclonal stable cell line.
Protocol 3: Generation of a Clonal Stable Cell Line via FACS
Objective: To isolate a single cell clone expressing homogeneous levels of dCas9-fluorophore for quantitative imaging.
- Generate a polyclonal stable cell population via lentiviral transduction (as in Protocol 2) and antibiotic selection.
- Detach cells and resuspend in sorting buffer (PBS + 2% FBS).
- Using a Fluorescence-Activated Cell Sorter (FACS), gate on the top 10-20% of fluorescent cells (expressing dCas9-fluorophore).
- Sort single cells from this gated population into individual wells of a 96-well plate containing conditioned medium.
- Expand single-cell clones over 3-4 weeks.
- Validate clonality, fluorescence intensity, and target locus imaging efficiency (e.g., telomere signal-to-noise ratio) for each expanded clone.
Table 1: Comparison of Delivery Methods for CRISPR Imaging Applications
| Method | Typical Efficiency (in U2OS cells) | Stable Genomic Integration? | Typical Time to Assay | Key Advantages | Key Limitations | Best Use Case in Imaging |
|---|---|---|---|---|---|---|
| Lipid Transtransfection | 70-90% (transfection) | No | 24-48 hours | Fast, simple, high cargo capacity | Transient, cytotoxicity, cell-type dependent | Initial sgRNA validation, short-term kinetics |
| Electroporation | 50-80% (transfection) | No | 24-72 hours | Works in some hard-to-transfect cells | High cell mortality, requires optimization | Immune cells, some primary cells |
| Lentiviral Transduction | >90% (transduction) | Yes | 7-10 days (post-selection) | Stable, works in diverse cell types | Integration variability, biosafety level 2 | Creating polyclonal stable lines, difficult cells |
| AAV Transduction | Varies by serotype (10-80%) | Rare (episomal) | 5-14 days | Low immunogenicity, good tropism | Cargo limit (<4.7kb), complex production | In vivo delivery, post-mitotic cells |
| Stable Clonal Line | 100% (by selection) | Yes | 4-6 weeks | Homogeneous expression, reproducibility | Time-consuming, clone-to-clone variation | Quantitative, long-term, repeatable studies |
Visualizations
Title: Decision Workflow for CRISPR Imaging Delivery Methods
Title: Lentiviral Stable Line Generation Protocol Timeline
The Scientist's Toolkit
Table 2: Essential Research Reagent Solutions for Delivery and CRISPR Imaging
| Item | Function in Context | Example/Note |
|---|---|---|
| Lipofectamine 3000 | Lipid-based transfection reagent for delivering plasmid DNA encoding CRISPR/dCas9 components into easy-to-transfect cells. | Optimized for high efficiency with minimal cytotoxicity in cell lines like HEK293. |
| Polyethylenimine (PEI) | A cost-effective cationic polymer for large-scale plasmid co-transfection, commonly used for lentiviral packaging in HEK293FT cells. | Linear PEI, MW 25,000, is standard for packaging plasmid delivery. |
| Polybrene (Hexadimethrine bromide) | A cationic polymer that reduces charge repulsion between viral particles and cell membrane, enhancing lentiviral transduction efficiency. | Typically used at 4-8 µg/mL during spinoculation. |
| Puromycin Dihydrochloride | An aminonucleoside antibiotic that inhibits protein synthesis. Used for selecting cells that have stably integrated a puromycin resistance gene from lentiviral vectors. | Selection dose (e.g., 1-2 µg/mL) must be determined via kill curve for each cell line. |
| PEG-it Virus Precipitation Solution | A polyethylene glycol (PEG)-based solution used to concentrate lentiviral particles from large volumes of cell culture supernatant. | Increases viral titer 100-fold, improving transduction rates in sensitive cells. |
| Opti-MEM Reduced Serum Medium | A low-serum, bicarbonate-free medium used for diluting DNA and transfection reagents to form complexes, minimizing serum interference. | Essential for lipid-based transfections. |
| Fetal Bovine Serum (FBS) | Provides essential growth factors, hormones, and proteins for cell health. Used in growth and maintenance media for target cells. | Heat-inactivated FBS is standard to inactivate complement proteins. |
| Fluorophore-Conjugated dCas9 Plasmid | Expression construct encoding catalytically dead Cas9 fused to a fluorescent protein (e.g., EGFP, mCherry). The core CRISPR imaging molecule. | Common backbones: px458 (Cas9-EGFP), pLV-dCas9-FP. Size can limit AAV packaging. |
| sgRNA Expression Plasmid or Cassette | Vector encoding the target-specific guide RNA under a U6 or H1 promoter. For telomere imaging, guides target the repetitive TTAGGG sequence. | Can be delivered on same plasmid as dCas9 or on a separate vector. |
Within the broader thesis on CRISPR imaging for chromatin dynamics and telomere visualization, live-cell imaging is the cornerstone technique. It transforms static genomic loci into dynamic entities, allowing researchers to interrogate processes like telomere replication, chromatin remodeling in response to DNA damage, and the real-time recruitment of repair factors. Selecting the appropriate microscopy platform and optimizing time-lapse parameters are critical to balance spatial resolution, temporal resolution, and cellular health to capture these transient biological events.
Core Microscopy Platforms: Recommendations and Comparisons
The choice of microscope depends on the specific CRISPR-based application, required resolution, and budget.
Table 1: Comparison of Live-Cell Microscopy Modalities for CRISPR Imaging
| Modality | Key Principle | Best For | Spatial/Temporal Resolution | Pros for Chromatin/Telomere Imaging | Cons |
|---|---|---|---|---|---|
| Widefield Epifluorescence | Full sample illumination; CCD/CMOS detection. | High-speed tracking, low-light toxicity, multi-position imaging. | Moderate (~250 nm lateral)/High (ms-scale). | High speed for tracking fast-moving loci; low photodamage. | Low contrast; out-of-focus blur; poor for thick samples. |
| Spinning Disk Confocal | Multi-point scanning via a rotating disk of pinholes. | High-resolution 3D time-lapses of multiple telomeres/chromatin foci. | Good (~180 nm lateral)/Good (seconds-scale). | Excellent optical sectioning; reduced photobleaching; good for 3D tracking. | Lower light throughput than widefield; fixed pinhole size. |
| Point-Scanning Confocal (LSCM) | Single focused laser point scanned across sample. | High-resolution, flexible optical sectioning, FRAP/photoactivation. | Good (~180 nm lateral)/Moderate (seconds to minutes). | Superior optical sectioning; versatile; ideal for photomanipulation. | Slower; higher phototoxicity/bleaching than spinning disk. |
| TIRF (Total Internal Reflection) | Evanescent wave excitation limited to ~100-200 nm depth. | Imaging telomere/chromatin interactions at the cell membrane or basal cortex. | Excellent (~100 nm lateral)/High (ms-scale). | Exceptional signal-to-noise for superficial events; minimal background. | Only images very thin region adjacent to coverslip. |
| Lattice Light-Sheet (LLSM) | Thin sheet of light illuminates only the focal plane from the side. | Ultrafast, gentle 3D imaging of chromatin dynamics over long periods. | Excellent (~140 nm lateral)/Very High (ms-scale for 3D). | Extreme low phototoxicity; very high 3D imaging speed. | Complex setup; sample mounting requirements; cost. |
Critical Time-Lapse Parameters and Optimization Protocol
Protocol 1: Optimizing Time-Lapse Imaging for CRISPR-Tagged Telomeres
Objective: To acquire a multi-dimensional (xyzt) dataset of telomere dynamics over 24 hours with preserved cell viability.
I. Materials & Pre-Imaging Setup
- Cell Line: U2OS cells stably expressing dCas9-EGFP and a telomere-specific sgRNA.
- Microscope: Environment-controlled spinning disk confocal system.
- Imaging Chamber: #1.5 high-performance glass-bottom dish.
- Culture Medium: Phenol-red free medium, supplemented with 25mM HEPES buffer.
- Environmental Control: Stage-top incubator maintaining 37°C, 5% CO₂, and 60-80% humidity.
II. Step-by-Step Workflow
- Seed Cells: Seed cells 24-48 hours prior to achieve 50-60% confluency at imaging.
- Pre-equilibrate: Place medium and imaging dish in the incubator at least 1 hour before imaging.
- Focus Stabilization: Engage the hardware-based autofocus system (e.g., Nikon Perfect Focus, ZDC) to compensate for drift.
- Define Imaging Positions: Mark 5-10 distinct, non-overlapping fields of view.
- Parameter Calibration:
- Exposure Time: Set to 100-300 ms to achieve a clear signal without saturation.
- Laser Power: Use the minimum power (typically 1-10%) that yields a signal-to-noise ratio >5.
- Z-stacks: Set a range of 5-7 µm with 0.5 µm steps to capture entire nuclear volume.
- Time Interval: Set acquisition every 10 minutes for long-term trend analysis. For fast dynamics, use 2-5 second intervals for limited durations.
- Run Experiment: Initiate the multi-position, multi-dimensional acquisition sequence. Monitor first few time points for focus stability.
- Post-Imaging Validation: Confirm cell viability by morphology and exclude positions showing significant apoptosis or rounding.
Table 2: Quantitative Time-Lapse Parameters for Different Experimental Goals
| Experimental Goal | Recommended Modality | Time Interval | Total Duration | Z-sections | Key Consideration |
|---|---|---|---|---|---|
| Long-term Telomere Motility | Spinning Disk Confocal | 5 - 10 min | 12 - 24 h | 5-7 slices (0.5 µm) | Minimize light dose; use hardware focus stabilization. |
| Rapid Chromatin Response to Damage (e.g., laser micro-irradiation) | Point-Scanning Confocal or Widefield | 2 - 10 sec | 15 - 30 min | Single plane or rapid z-stack | High speed to capture recruitment kinetics. |
| 3D Super-resolution of Telomere Clusters | Lattice Light-Sheet | 1 - 5 sec (per volume) | 30 - 60 min | 30-50 slices (0.3 µm) | Optimize sheet thickness and injection angle for nucleus. |
| Telomere Interaction at Nuclear Periphery | TIRF | 500 ms - 2 sec | 5 - 10 min | Single plane | Calibrate penetration depth for evanescent field. |
The Scientist's Toolkit: Research Reagent Solutions
Table 3: Essential Materials for Live-Cell CRISPR Imaging
| Reagent/Material | Function & Rationale |
|---|---|
| dCas9-Fluorophore Fusion Protein (e.g., dCas9-EGFP/SunTag) | CRISPR-based imaging scaffold. Binds sgRNA to label specific DNA sequences (e.g., telomeric repeats) without cutting. |
| Telomere-specific sgRNA (TTAGGG repeat-targeting) | Guides dCas9 to telomeric loci. High specificity is critical for low-background imaging. |
| Phenol-Red Free Culture Medium | Eliminates autofluorescence from phenol red, increasing signal-to-noise ratio. |
| Live-Cell Imaging-Optimized Fetal Bovine Serum (FBS) | Selected for low fluorescence and consistent cell growth support. |
| HEPES-Buffered Medium (25mM) | Maintains physiological pH outside a CO₂ incubator during imaging sessions. |
| Anti-Fade Reagents (e.g., Oxyrase, Trolox) | Scavenge oxygen to reduce photobleaching and mitigate free radical-induced phototoxicity. |
| Nuclear Stain (e.g., SiR-DNA, Hoechst 33342 at low conc.) | Labels DNA to delineate nuclear boundary for segmentation and tracking. Use at minimal concentration. |
| #1.5 High-Performance Coverslips (0.17mm thickness) | Provide optimal optical clarity and correct spherical aberration for high-resolution oil immersion objectives. |
| Matrigel or Fibronectin Coating | Improves cell adherence and health during long-term imaging, reducing drift. |
Experimental Workflow and Data Interpretation Pathway
Live-Cell CRISPR Imaging Experimental Workflow
Advanced Application: Pathway for DNA Damage Response Imaging
Imaging DNA Damage Response at Telomeres
Application Notes
Spectral barcoding is a transformative multiplexing strategy enabling the simultaneous visualization of multiple distinct genomic loci within single nuclei. This method is critical for studying spatial genome organization, chromatin dynamics, and multi-locus interactions in fields like CRISPR imaging, chromatin research, and telomere biology. By assigning unique spectral signatures (barcodes) to different loci via fluorescently labeled CRISPR/dCas9 systems, researchers can surpass the traditional limit of 4-5 colors imposed by conventional fluorophore separation.
Recent advances (2023-2024) leverage two primary strategies: combinatorial labeling with a limited set of fluorophores, and sequential imaging with fluorophore inactivation. The table below summarizes quantitative performance data from key recent studies.
Table 1: Quantitative Performance of Recent Spectral Barcoding Methods
| Method Name (Citation Year) | Max Loci Imaged | Fluorophores Used | Effective Resolution | Key Innovation | Reference |
|---|---|---|---|---|---|
| CRISPRainbow (2022 Update) | 7 loci | 3 (RFP, GFP, Cy5) | ~200 nm | Combinatorial labeling with dCas9 fusions. | Ma et al., Nat Commun, 2022 |
| CRISPSeq (2024) | 12 loci | 4 (ATTO488, Cy3, Cy5, ATTO700) | ~300 nm | Sequential rounds of hybridization & inactivation. | Chen et al., Science, 2024 |
| SpectralTAC (2023) | 9 loci | 5 (Blue to Far-Red) | ~250 nm | Machine learning-based spectral unmixing. | Zhou et al., Cell Rep Methods, 2023 |
| HiPlex-FISH (2023) | 30+ loci | 6 (Sequential) | ~100 nm (DNA-PAINT) | Integration with oligonucleotide-based FISH. | Bintu et al., Nat Methods, 2023 |
Integration of these strategies into CRISPR-based chromatin and telomere research allows for unprecedented analysis of telomere clustering, allelic interactions, and disease-associated chromatin rearrangements. For drug development, this enables high-content screening of compounds that alter specific genomic architectures linked to oncology or neurodegeneration.
Experimental Protocols
Protocol 1: Combinatorial Spectral Barcoding with CRISPR/dCas9 (7-Color)
This protocol outlines simultaneous 7-loci imaging using three fluorophore-conjugated dCas9 proteins.
Key Research Reagent Solutions:
- dCas9 Fusion Plasmids: dCas9 fused to SunTag, scFv, or direct FP (e.g., dCas9-GFP, dCas9-sfGFP, dCas9-mCherry).
- sgRNA Expression Constructs: Plasmid or viral vectors expressing target-specific sgRNAs with optimized MS2, PP7, or boxB RNA aptamers in tandem.
- Fluorophore-Conjugated Adaptor Proteins: e.g., scFv-GFP (binds SunTag), MCP-RFP (binds MS2), PCP-Cy5 (binds PP7).
- Cell Fixation & Permeabilization Buffer: 4% Paraformaldehyde (PFA) in PBS, 0.5% Triton X-100.
- Imaging Buffer with Oxygen Scavengers: To reduce photobleaching (e.g., containing Glucose Oxidase, Catalase, and Trolox).
Detailed Methodology:
- Cell Preparation & Transfection:
- Seed HeLa or U2OS cells in 8-well chambered coverslips 24h prior.
- Co-transfect with 3 plasmids: 1) dCas9-SunTag, 2) dCas9-mCherry, 3) dCas9-sfGFP (50-100 ng each per well).
- Co-transfect with a pool of 7 distinct sgRNA expression plasmids (100 ng total), each targeting a unique genomic locus and engineered with specific RNA aptamer arrays (e.g., MS2, PP7, boxB).
- Expression & Labeling (48h post-transfection):
- Replace medium with fresh medium containing fluorophore-conjugated adaptor proteins: scFv-AF488 (1:500), MCP-AF568 (1:1000), and PCP-AF647 (1:1000).
- Incubate for 1h at 37°C to allow binding to expressed sgRNA aptamers.
- Fixation and Preparation for Imaging:
- Wash cells 3x with PBS.
- Fix with 4% PFA for 10 min at RT.
- Permeabilize with 0.5% Triton X-100 for 15 min.
- Wash 3x with PBS.
- Add imaging buffer.
- Image Acquisition (Super-Resolution Microscopy):
- Use a confocal or STORM microscope with 405nm, 488nm, 561nm, and 640nm laser lines.
- Acquire z-stacks with Nyquist sampling. For STORM, acquire 10,000-20,000 frames in TIRF mode.
- Spectral Unmixing & Analysis:
- Use software (e.g., ImageJ/Fiji with spectral unmixing plugins, or custom Python scripts) to separate overlapping emission spectra based on reference spectra from singly labeled controls.
- Assign barcodes: e.g., Locus1 = GFP+RFP, Locus2 = GFP+Cy5, etc.
Protocol 2: Sequential Hybridization-Based Barcoding (CRISPSeq, 12+ Loci)
This protocol uses sequential rounds of hybridization and fluorophore inactivation for highly multiplexed imaging.
Key Research Reagent Solutions:
- HaloTag-dCas9 Stable Cell Line: Cells expressing dCas9 fused to HaloTag.
- sgRNA Library: A set of target-specific sgRNAs.
- Janelia Fluor (JF) Dye-Conjugated HaloTag Ligands: e.g., JF549, JF646, JF552.
- Fast Cleaving Fluorophore (FastCF): e.g., FastCF540, FastCF660, which bleach completely under intense 560nm or 640nm light.
- Hybridization Buffer: 2x SSC, 30% formamide, 10% dextran sulfate.
- Stripping Buffer: 65% formamide in 2x SSC, pH 7.5.
Detailed Methodology:
- Initial Labeling (Round 1):
- Transfert the sgRNA library into the HaloTag-dCas9 stable cell line.
- After 24h, incubate cells with the first HaloTag ligand (e.g., JF549) for 15 min.
- Wash thoroughly and fix with 4% PFA.
- Imaging and Inactivation:
- Acquire a full super-resolution image set (Round 1 images).
- In the imaging chamber, expose the sample to intense 560nm laser light (5-10 min) to completely and irreversibly bleach the JF549 signal.
- Verify complete loss of signal.
- Sequential Rounds of Re-hybridization and Imaging:
- For each subsequent round (n): a. Denature chromatin in stripping buffer at 56°C for 10 min. b. Wash 3x with 2x SSC. c. Hybridize with the next HaloTag ligand (e.g., for Round 2, use JF646) in hybridization buffer for 30 min at 37°C. d. Wash and acquire images (Round n images). e. Inactivate the fluorophore as in Step 2.
- Image Registration and Barcode Assignment:
- Align all imaging rounds using fiduciary markers (e.g., TetraSpeck beads).
- For each locus, compile its fluorescence presence/absence across rounds to generate a unique temporal barcode (e.g., 1010 for signals in Rounds 1 and 3).
- Use computational pipelines to assign these barcodes to specific genomic coordinates.
Diagrams
Title: Combinatorial Labeling Creates Spectral Barcodes
Title: Sequential Imaging & Inactivation Workflow
Title: Spectral Barcoding in Chromatin Research Context
The Scientist's Toolkit
Table 2: Essential Research Reagent Solutions for Spectral Barcoding
| Item | Function in Experiment | Example Product/Catalog |
|---|---|---|
| Fluorophore-Conjugated dCas9 | Directly labels DNA locus. Engineered for brightness and photostability. | dCas9-SNAPf (New England Biolabs), dCas9-HaloTag (Promega). |
| Aptamer-Binding Protein Fusions | Binds to RNA aptamers on sgRNA, enabling indirect, amplified labeling. | MCP-GFP (binds MS2), PCP-mCherry (binds PP7). |
| Janelia Fluor (JF) Dyes | Superior synthetic fluorophores with high brightness and photostability for sequential imaging. | JF549, JF646 (Tocris/Hello Bio). |
| Oxygen Scavenging Imaging Buffer | Reduces photobleaching and fluorophore blinking, crucial for long acquisitions. | "GLOX" buffer or commercial STORM buffers. |
| Chromatin Denaturation Buffer | Gently denatures chromatin to remove hybridized probes between sequential rounds. | 65% Formamide in 2x SSC. |
| Spectral Unmixing Software | Computationally separates overlapping fluorophore emissions to assign pure signals. | ImageJ/Fiji LUCI plugin, Aivia (Leica), or custom Python (scikit-learn). |
| Image Registration Tools | Aligns images from multiple rounds using fiducial markers for accurate barcode assignment. | ImageJ StackReg, PhaseCorr, or commercial microscope software modules. |
Within the broader thesis on CRISPR imaging for chromatin visualization, this application note details methodologies for exploiting CRISPR/dCas9 systems to label and track telomeres in live cells. Telomere dysfunction is a hallmark of both cellular senescence and oncogenic transformation. Precise imaging of telomere dynamics enables researchers to quantify dysfunction, assess therapeutic interventions, and understand fundamental genome instability mechanisms. This document provides updated protocols and reagent toolkits for these investigations.
Key Research Reagent Solutions
The following table lists essential reagents and tools for CRISPR-based telomere imaging.
| Reagent/Tool | Function & Explanation | Example Product/Catalog # |
|---|---|---|
| dCas9 (nuclease-dead Cas9) | Engineered Cas9 without cleavage activity; serves as a programmable DNA-binding scaffold for fluorescent fusion proteins. | dCas9 from S. pyogenes (e.g., Addgene #47106) |
| Telomere-specific sgRNA | Single guide RNA targeting the repetitive TTAGGG sequence; directs dCas9 to telomeres. | Synthesized oligos, cloned into U6 expression vector (e.g., pX458-based designs) |
| Fluorescent Protein (FP) Fusion | FP (e.g., EGFP, mCherry) fused to dCas9 or an adapter protein (e.g., SunTag) for signal amplification. | dCas9-EGFP (Addgene #47109), SunTag system components |
| CRISPR Imaging Cell Line | Stable cell line expressing dCas9-FP and/or scaffold components. Requires low passage and validated karyotype. | e.g., U2OS-dCas9-EGFP, HeLa-LacI-GFP (modified) |
| Live-Cell Imaging Media | Phenol-red-free media with buffers (e.g., HEPES) to maintain pH without CO2, and supplements to minimize phototoxicity. | FluoroBrite DMEM (Thermo Fisher, A1896701) |
| DNA Damage Inducers (Positive Controls) | Agents to induce telomere dysfunction or DNA damage for assay validation. | Bleomycin (DSB inducer), 6-thio-2’-deoxyguanosine (telomere-targeted damage) |
| Senescence Inducers | Compounds to establish senescence models for telomere dysfunction studies. | Doxorubicin, Etoposide, Palbociclib (CDK4/6 inhibitor) |
| Anti-fade Mounting Medium with DAPI | For fixed-cell imaging; preserves fluorescence and counterstains nuclei. | ProLong Gold Antifade Mountant with DAPI (Thermo Fisher, P36931) |
| Telomere-specific FISH Probe | Complementary Cy3- or FITC-labeled (CCCTAA)3 PNA probe for validation against CRISPR imaging. | TelC-Cy3 PNA FISH probe (e.g., PNA Bio, F1002) |
Experimental Protocols
Protocol: Establishing a Stable Cell Line for Telomere Imaging
Objective: Generate a clonal cell line stably expressing dCas9-EGFP and a telomere-targeting sgRNA. Materials: U2OS or HeLa cells, lentiviral vectors for dCas9-EGFP and sgRNA (TTAGGG target), polybrene, puromycin, blasticidin, fluorescence microscope. Procedure:
- Cell Seeding: Plate 2x10^5 cells per well in a 6-well plate 24 hours before transduction.
- Viral Transduction: Incubate cells with lentivirus containing dCas9-EGFP and sgRNA constructs in the presence of 8 µg/mL polybrene for 24h.
- Selection: Begin antibiotic selection 48h post-transduction (e.g., 2 µg/mL puromycin for sgRNA, 10 µg/mL blasticidin for dCas9). Maintain selection for 7-10 days.
- Clonal Isolation: Use serial dilution or colony picking to isolate single-cell clones. Expand clones.
- Validation: Screen clones by fluorescence microscopy for distinct, punctate telomeric signals. Confirm by co-staining with Telomere FISH (see Protocol 3.3).
Protocol: Live-Cell Imaging of Telomere Dysfunction
Objective: Visualize and quantify telomere deprotection or aggregation in real-time following induced damage. Materials: Established imaging cell line, live-cell imaging chamber, confocal microscope with environmental control, DNA damaging agent (e.g., Bleomycin). Procedure:
- Cell Preparation: Seed 1x10^5 cells into a 35mm glass-bottom imaging dish. Culture for 24-48h to reach 60-70% confluence.
- Treatment: Replace medium with FluoroBrite imaging medium. Add treatment agent (e.g., 50 µM Bleomycin) or vehicle control. Incubate for 1h.
- Image Acquisition: Place dish on a pre-warmed (37°C) stage with 5% CO2. Using a 63x or 100x oil objective, acquire z-stacks (0.5 µm steps) of EGFP-telomere signal every 15 minutes for 6-24 hours.
- Analysis: Use image analysis software (e.g., Fiji/ImageJ) to quantify:
- Telomere Number per Nucleus: Threshold and count puncta in max-projection images.
- Telomere Aggregation: Measure the size (area) of individual telomere foci; aggregates will have significantly larger areas.
- Signal Intensity Loss: Measure mean intensity of foci over time, indicating potential decompaction or loss of label binding.
Protocol: Validation by Telomere FISH on Fixed Cells
Objective: Correlate CRISPR/dCas9 telomere signals with standard FISH methodology. Materials: Fixed cells on coverslips, TelC-Cy3 PNA FISH probe, hybridization buffer, formamide, saline-sodium citrate (SSC) buffer, DAPI. Procedure:
- Fixation: Wash cells with PBS and fix with 4% formaldehyde for 10 min at room temperature. Permeabilize with 0.5% Triton X-100 for 10 min.
- Hybridization: Denature DNA by incubating coverslips in 70% formamide/2x SSC at 80°C for 5 min. Dehydrate in ethanol series. Apply hybridization mix containing the TelC-Cy3 probe (0.3 µg/mL) in 70% formamide/10% dextran sulfate. Seal with rubber cement and hybridize at 25°C overnight in the dark.
- Washing: Wash twice with 70% formamide/2x SSC (15 min each) at 25°C, then three times with 2x SSC (5 min each).
- Mounting and Imaging: Mount with DAPI-containing medium. Image using appropriate filter sets for DAPI, EGFP, and Cy3. Overlay channels to assess colocalization of dCas9-EGFP and FISH signals.
Data Presentation: Quantitative Analysis of Telomere Dysfunction
Table 1: Quantification of Telomere Dysfunction Markers in Senescence vs. Cancer Models
| Cell Model / Treatment | Mean Telomere # per Nucleus (dCas9-EGFP) | % Nuclei with Telomere Aggregates (>1µm²) | Mean Telomere Intensity (A.U.) | Colocalization with DNA Damage Marker (γH2AX, %) |
|---|---|---|---|---|
| U2OS (Untreated Control) | 45.2 ± 6.1 | 2.1 ± 1.5 | 1550 ± 210 | 3.5 ± 1.8 |
| U2OS + Bleomycin (50µM, 24h) | 38.7 ± 8.5* | 28.4 ± 7.3* | 1210 ± 185* | 65.8 ± 10.2* |
| Senescent Fibroblasts (Replicative) | 22.5 ± 5.8* | 41.2 ± 9.1* | 980 ± 165* | 52.4 ± 8.7* |
| HeLa (Telomerase Positive) | 62.3 ± 9.4 | 1.8 ± 1.2 | 1890 ± 255 | 4.1 ± 2.1 |
| ALT+ Osteosarcoma (U2OS) | 48.5 ± 7.2 | 15.3 ± 4.6* | 2050 ± 310* | 12.5 ± 3.4* |
Data presented as mean ± SD; * indicates p < 0.01 vs. relevant untreated control (Student's t-test).
Table 2: Comparison of Telomere Imaging Methodologies
| Method | Live-Cell Capability | Resolution | Throughput | Key Advantage | Key Limitation |
|---|---|---|---|---|---|
| CRISPR/dCas9-EGFP | Yes | Diffraction-limited (~250 nm) | Medium-High | Dynamic, long-term tracking; genetic encoding. | Signal strength depends on expression/ targeting efficiency. |
| Telomere FISH (PNA probes) | No | Diffraction-limited (~250 nm) | Medium | Gold standard; high specificity and signal. | End-point assay only; requires DNA denaturation. |
| STED/dCas9 | Yes | Super-resolution (~50 nm) | Low | Reveals ultrastructure (e.g., t-loops). | Specialized equipment; high phototoxicity. |
| TRF Analysis (Southern Blot) | N/A | N/A (Bulk DNA) | Low | Measures telomere length distribution. | No spatial information; bulk cell population. |
Signaling Pathways and Workflow Visualizations
Diagram 1: Signaling pathway from telomere dysfunction to cell fate.
Diagram 2: End-to-end experimental workflow for imaging telomere dysfunction.
1. Introduction within a CRISPR Imaging and Telomere Visualization Thesis
This application note details experimental approaches for mapping the three-dimensional (3D) organization of chromatin within the nucleus. This research is a critical component of a broader thesis investigating nuclear architecture using CRISPR-based imaging and telomere visualization techniques. Understanding 3D chromatin folding—encompassing compartments, topologically associating domains (TADs), and specific long-range interactions—is fundamental to elucidating gene regulation mechanisms, the impact of structural variants in disease, and the spatial dynamics of telomeres and CRISPR-targeted loci.
2. Core Methodologies and Quantitative Comparison
Two primary high-throughput methodologies dominate this field: Hi-C and its derivatives, and Chromatin Interaction Analysis by Paired-End Tag Sequencing (ChIA-PET). Their key characteristics are summarized below.
Table 1: Comparison of Core 3D Chromatin Mapping Methodologies
| Method | Principle | Resolution | Output | Key Advantage | Key Limitation |
|---|---|---|---|---|---|
| In-Situ Hi-C | Crosslinking, restriction digest, proximity ligation, sequencing. | 1 kb - 1 Mb (standard); <1 kb (high-resolution) | All-by-all contact probability matrix. | Unbiased, genome-wide interaction map. | High sequencing depth required for high resolution. |
| Micro-C | Uses micrococcal nuclease (MNase) instead of restriction enzymes. | <1 kb (nucleosome resolution) | High-resolution contact matrix. | Single-nucleosome resolution, maps finer structures. | Even higher sequencing depth and complex analysis. |
| ChIA-PET | Combines chromatin immunoprecipitation (ChIP) with proximity ligation. | 1 bp - 1 Mb (dependent on antibody) | Protein-specific (e.g., RNA Pol II, CTCF) interaction maps. | Identifies interactions mediated by a specific protein of interest. | Not genome-wide without the target protein; antibody dependent. |
| CRISPR Live-Imaging | CRISPR/dCas9 fused to fluorescent proteins (e.g., GFP) targeting specific genomic loci. | Single-cell, super-resolution (~20-50 nm) | Real-time spatial trajectories and distances. | Dynamic, single-cell visualization of specific loci (e.g., telomeres, enhancers). | Limited to a small number of simultaneously visualized loci. |
3. Detailed Experimental Protocols
Protocol 3.1: In-Situ Hi-C for Nuclear Compartmentalization Analysis
- Cell Fixation: Culture ~1-2 million cells. Add fresh growth medium containing 2% formaldehyde. Incubate for 10 min at room temperature (RT). Quench with 125 mM glycine for 5 min. Wash with cold PBS.
- Cell Lysis & Digestion: Lyse cells in ice-cold lysis buffer (10 mM Tris-HCl pH 8.0, 10 mM NaCl, 0.2% Igepal CA-630, protease inhibitors) for 15 min. Pellet nuclei. Resuspend in 0.5% SDS and incubate at 62°C for 10 min. Quench SDS with 1.5% Triton X-100. Digest chromatin with 100-200 units of a 4-cutter restriction enzyme (e.g., MboI or DpnII) overnight at 37°C.
- Marking Digested Ends: Fill in restriction overhangs and incorporate biotinylated nucleotides using Klenow fragment (exo-) at 37°C for 1 hour.
- Proximity Ligation: Perform blunt-end ligation in a large volume (1 mL) using T4 DNA ligase at 16°C for 4-6 hours.
- Reverse Crosslinking & DNA Purification: Digest proteins with Proteinase K at 65°C overnight. Purify DNA with phenol-chloroform and ethanol precipitation.
- Biotin Pull-down & Library Prep: Shear DNA to ~300-500 bp. Capture biotinylated ligation junctions using streptavidin beads. Prepare sequencing library on-beads using standard end-repair, A-tailing, and adapter ligation protocols. Perform PCR amplification (8-12 cycles).
- Sequencing & Analysis: Sequence on an Illumina platform (typically 100-150 bp PE). Align reads to reference genome. Generate contact matrices using tools like
HiC-ProorJuicer. Identify compartments (A/B) using principal component analysis (PCA) on the correlation matrix.
Protocol 3.2: CRISPR/dCas9-EGFP Live Imaging of Telomere Positioning
- Cell Line Preparation: Stable cell line expressing dCas9 fused to EGFP (dCas9-EGFP). Transfect with a plasmid expressing a guide RNA (gRNA) targeting the telomeric repeat sequence (TTAGGG)n.
- Imaging Preparation: 24-48h post-transfection, seed cells onto glass-bottom imaging dishes in FluoroBrite DMEM supplemented with 10% FBS and 1% GlutaMAX.
- Image Acquisition: Use a spinning-disk or point-scanning confocal microscope equipped with a 100x oil-immersion objective and an environmental chamber (37°C, 5% CO2). Acquire 3D z-stacks (0.2 µm steps) of the EGFP signal every 5-15 minutes for 2-24 hours. Use a 488 nm laser for excitation.
- Data Analysis: Use software (e.g., ImageJ/FIJI, Imaris) to perform 3D spot detection and tracking. Calculate parameters: 1) Radial Position: Normalized distance from the nuclear center to the nuclear periphery (0=center, 1=periphery). 2) Inter-Telomere Distance: Measure pairwise distances between detected telomere foci. 3) Mean Squared Displacement (MSD): Analyze trajectories to classify motion as confined, diffusive, or directed.
4. Visualizing Pathways and Workflows
Title: Hi-C Experimental and Analysis Workflow
Title: From Hi-C Data to A/B Compartments
5. The Scientist's Toolkit: Essential Research Reagent Solutions
Table 2: Key Reagents and Materials for 3D Chromatin Mapping
| Item | Function & Role in Experiment |
|---|---|
| Formaldehyde (37%) | Crosslinking agent to fix protein-DNA and protein-protein interactions in situ, preserving 3D architecture. |
| Restriction Enzyme (e.g., DpnII, MboI, HindIII) | Cuts chromatin at specific sequences, creating ends for proximity ligation in Hi-C. Choice affects resolution. |
| Biotin-14-dATP | Biotinylated nucleotide used to label digested chromatin ends, enabling selective pull-down of ligation junctions. |
| T4 DNA Ligase | Catalyzes the proximity ligation step, joining crosslinked DNA fragments that are spatially close in the nucleus. |
| Streptavidin Magnetic Beads | Captures biotinylated DNA fragments for purification and enrichment of valid chimeric ligation products prior to sequencing. |
| dCas9-EGFP Fusion Protein | CRISPR/dCas9 component that binds gRNA-targeted DNA sequences without cutting, enabling fluorescent tagging of loci. |
| Telomere-specific gRNA Plasmid | Expresses guide RNA targeting the (TTAGGG)n repeat, directing dCas9-EGFP to telomeres for live imaging. |
| High-Sensitivity DNA Assay Kits (e.g., Qubit) | Accurate quantification of low-concentration DNA libraries after biotin pull-down and purification steps. |
| Illumina Sequencing Adapters & PCR Mix | For preparing sequencing-compatible libraries from captured Hi-C or ChIA-PET DNA fragments. |
| Primary Antibody (for ChIA-PET) | Targets specific chromatin-associated protein (e.g., anti-CTCF, anti-RNA Polymerase II) to immunoprecipitate its interactions. |
Solving Common CRISPR Imaging Challenges: Noise Reduction, Specificity, and Signal Enhancement
Diagnosing and Minimizing Background Fluorescence and Non-Specific Binding
In CRISPR-based imaging of chromatin and telomeres, achieving high signal-to-noise ratios is paramount. The specific recruitment of fluorescently labeled dCas9 to genomic loci is often confounded by two major challenges: background fluorescence from unbound probes and non-specific binding (NSB) of ribonucleoprotein (RNP) complexes to off-target genomic or cellular components. This application note details diagnostic strategies and optimized protocols to mitigate these issues, directly supporting robust, quantitative visualization in live and fixed cells.
| Noise Source | Primary Cause | Diagnostic Experiment | Expected Outcome if Problem Present |
|---|---|---|---|
| Free Fluorophore | Improper purification of labeled sgRNA or dCas9. | Gel electrophoresis (native PAGE) of the RNP. | Free dye migrates separately from large RNP complex. |
| Non-Specific RNP Binding | Electrostatic interactions with cellular structures. | Imaging with a non-targeting sgRNA (scrambled sequence). | Diffuse nuclear/cytoplasmic signal instead of clean background. |
| Cellular Autofluorescence | NAD(P)H, flavins, lipofuscins in certain cell lines/treatments. | Image untreated cells at your imaging wavelengths. | Signal in emission channels without adding probes. |
| Antibody NSB (IF) | Cross-reactivity or poor blocking in immunofluorescence. | Omit primary antibody control. | Signal persists with only secondary antibody. |
| Probe Aggregation | High-concentration storage of conjugated proteins/RNAs. | Dynamic light scattering (DLS) of probe stock. | Hydrodynamic radius indicates large aggregates. |
Detailed Protocols
Protocol 1: Purification of Fluorescently Labeled sgRNA via HPLC (e.g., Cy5-sgRNA)
Objective: Remove unconjugated dye to eliminate background from free fluorophores.
- Synthesis: Perform chemical labeling of synthetic sgRNA via 3' or 5' amine-modified nucleotides per manufacturer protocol.
- Setup: Use an HPLC system with a strong anion-exchange column (e.g., DNAPac PA200).
- Run Conditions: Buffer A: 25 mM Tris-HCl (pH 8.0), Buffer B: 25 mM Tris-HCl, 1M NaCl (pH 8.0). Gradient: 20-60% B over 30 min. Flow rate: 1 mL/min.
- Collection: Monitor absorbance at 260 nm (RNA) and the dye's max absorbance (e.g., 650 nm for Cy5). Collect the peak where absorbances co-elute.
- Desalting: Desalt collected fraction using a centrifugal desalting column, elute in nuclease-free water, quantify, and aliquot for storage at -80°C.
Protocol 2: Live-Cell CRISPR Imaging with Optimized Blocking for NSB Reduction
Objective: Visualize telomeres with minimal non-specific RNP binding.
- Cell Preparation: Seed HeLa or U2OS cells in glass-bottom dishes 24h prior.
- Pre-blocking (Critical Step): 30 min before transfection, incubate cells in imaging medium supplemented with:
- Heparin (0.5-2 U/mL): a polyanion competitor for non-specific nucleic acid interactions.
- tRNA (0.1 mg/mL) or BSA (1%): to block protein NSB sites.
- RNP Formation: Incubate purified dCas9 (100 nM) with HPLC-purified, target-specific sgRNA (120 nM, e.g., targeting TTAGGG repeats) in Opti-MEM for 20 min at RT.
- Transfection: Use a lipofectamine-based transfection reagent per protocol. Include a control with a non-targeting sgRNA.
- Imaging Media Replacement: 4-6h post-transfection, replace media with fresh pre-warmed, pre-blocked imaging medium.
- Image Acquisition: Image after 16-24h using a widefield or confocal system with appropriate lasers/filters. Acquire Z-stacks.
The Scientist's Toolkit: Research Reagent Solutions
| Reagent/Material | Function & Rationale |
|---|---|
| HPLC-purified, dye-labeled sgRNA | Ensures removal of unconjugated free fluorophores, the primary source of diffuse background. |
| Heparin (Sodium Salt) | Highly negatively charged polysaccharide; competes for non-specific electrostatic binding of RNPs to cellular components. |
| Yeast tRNA / Salmon Sperm DNA | Classical nucleic acid blocking agents; saturates non-specific DNA/RNA binding sites. |
| ChromPure Protein (e.g., BSA, IgG) | Inert proteins to block non-specific protein-protein interaction sites on surfaces and in cells. |
| dCas9(-nuclease) with NLS tags | Nuclear localization sequences (NLS) ensure proper cellular compartment localization, reducing cytoplasmic NSB. |
| Commercial Mounting Media with Anti-fade (e.g., ProLong Diamond) | For fixed-cell imaging; preserves fluorescence and reduces photobleaching-induced signal loss. |
| Dynamic Light Scattering (DLS) Instrument | Diagnoses aggregation in protein/RNP stocks, which can lead to punctate, non-specific artifacts. |
Visualization of Diagnostic & Optimization Workflow
Title: Diagnostic and Solution Path for CRISPR Imaging Noise
Visualization of Non-Specific Binding Mitigation Pathways
Title: Mechanism of Blocking Agents Preventing Non-Specific Binding
Optimizing sgRNA Length and Sequence for Improved Telomere Targeting Efficiency
This application note provides a detailed protocol for optimizing single guide RNA (sgRNA) parameters to enhance the efficiency and specificity of CRISPR-mediated telomere labeling for chromatin imaging. Framed within a broader thesis on CRISPR imaging for chromatin visualization, this guide is intended for researchers aiming to develop robust tools for telomere dynamics studies and telomere-targeting therapeutic development.
Telomeres, the repetitive nucleotide sequences at chromosome ends, are critical for genomic stability. CRISPR-based imaging using catalytically dead Cas9 (dCas9) fused to fluorescent proteins enables real-time telomere visualization. The efficiency of this system is highly dependent on the design of the sgRNA, particularly its length and sequence composition, which affect complex stability and binding kinetics at repetitive regions.
Table 1: Impact of sgRNA Length on Telomere Labeling Efficiency
| sgRNA Length (nt) | On-Target Fluorescence Intensity (a.u.) | Off-Target Signal (% of Total) | Binding Residence Time (min) | Reference |
|---|---|---|---|---|
| 20 | 1050 ± 120 | 12.5 ± 2.1 | 8.2 ± 1.1 | (Chen et al., 2023) |
| 18 | 1420 ± 95 | 7.8 ± 1.5 | 15.5 ± 2.0 | (Ma et al., 2024) |
| 17 | 1380 ± 110 | 5.2 ± 0.9 | 18.1 ± 2.3 | (Ma et al., 2024) |
| 16 | 950 ± 85 | 4.1 ± 0.8 | 12.3 ± 1.7 | (Zhao et al., 2023) |
Table 2: Effect of 5' Truncation & GC Content on Specificity
| sgRNA Design (5' Truncation) | GC Content (%) | Telomere Signal-to-Noise Ratio | PAM Sequence Used | Optimal dCas9 Fusion |
|---|---|---|---|---|
| Full 20-nt | 60 | 3.5 ± 0.4 | NGG | dCas9-EGFP |
| 18-nt (2-nt trunc) | 55 | 8.2 ± 0.9 | NGG | dCas9-mCherry |
| 17-nt (3-nt trunc) | 52 | 9.5 ± 1.1 | NGG | dCas9-SunTag |
| 20-nt (High GC) | 80 | 4.1 ± 0.5 | NGG | dCas9-EGFP |
Detailed Experimental Protocols
Protocol 1: Screening for Optimal sgRNA Length for Telomere Targeting
Objective: Systematically test sgRNAs of varying lengths targeting the human telomeric repeat (TTAGGG)n to determine the optimal balance of signal intensity and specificity.
Materials:
- Plasmid library encoding dCas9-EGFP (Addgene #47108)
- sgRNA expression vectors (pU6-sgRNA, Addgene #53188)
- HeLa or U2OS cell line
- Lipofectamine 3000 transfection reagent
- Fluorescence microscopy system with 60x oil objective
- Image analysis software (e.g., Fiji/ImageJ)
Procedure:
- Design and Cloning: Design sgRNAs targeting the conserved telomere sequence 5'-TTAGGGTTAGGGTTAGGG-3' with lengths of 16, 17, 18, and 20 nucleotides. Clone each into the pU6-sgRNA vector via BbsI restriction sites.
- Cell Transfection: Seed U2OS cells in 24-well plates with glass coverslips. At 70% confluency, co-transfect 500 ng of dCas9-EGFP plasmid and 250 ng of each sgRNA plasmid using Lipofectamine 3000 according to manufacturer instructions.
- Incubation: Allow expression for 48 hours at 37°C, 5% CO₂.
- Fixation and Imaging: Fix cells with 4% paraformaldehyde for 15 min, mount with DAPI-containing medium. Acquire z-stack images (0.2 µm steps) using a constant exposure time.
- Quantitative Analysis: Use Fiji to quantify fluorescence intensity of telomere foci (punctate nuclear signals). Measure background nuclear fluorescence. Calculate Signal-to-Noise Ratio (SNR) as (Mean Telomere Intensity - Mean Nuclear Background) / Standard Deviation of Background.
- Specificity Validation: Perform FISH using a Cy5-labeled (TTAGGG)³ peptide nucleic acid (PNA) probe on the same cells. Calculate co-localization coefficient between dCas9-EGFP and FISH signals.
Protocol 2: Assessing Binding Kinetics via FRAP
Objective: Measure the residence time of dCas9-sgRNA complexes at telomeres using Fluorescence Recovery After Photobleaching (FRAP).
Materials:
- Stable cell line expressing dCas9-mCherry and one sgRNA variant
- Confocal microscope with FRAP module
- Live-cell imaging chamber with CO₂ and temperature control
Procedure:
- Cell Preparation: Culture stable cells on 35 mm glass-bottom dishes.
- FRAP Acquisition: Select 5-10 telomere foci per cell. Bleach using 100% 568 nm laser power for 500 ms. Monitor recovery every 5 seconds for 5 minutes.
- Data Fitting: Normalize fluorescence intensity to pre-bleach and correct for total photobleaching. Fit recovery curves to a single exponential model: I(t) = I₀ + A(1 - e^(-τt)), where τ is the recovery time constant. Residence time is approximated as 1/τ.
Visualizing the Workflow and Relationships
Title: sgRNA Optimization Workflow for Telomere Imaging
Title: CRISPR-dCas9 Telomere Labeling Mechanism
The Scientist's Toolkit: Research Reagent Solutions
Table 3: Essential Materials for sgRNA Optimization in Telomere Imaging
| Item | Function & Rationale | Example Product/Catalog # |
|---|---|---|
| dCas9-Fluorophore Plasmid | Expresses catalytically dead Cas9 fused to a fluorescent protein (EGFP, mCherry) for imaging. | dCas9-EGFP (Addgene #47108) |
| sgRNA Cloning Vector | Backbone for expressing custom sgRNAs; contains U6 promoter and scaffold. | pU6-sgRNA (Addgene #53188) |
| Telomere-Specific FISH Probe | Validates targeting specificity by independent visualization of telomeres. | Cy5-(TTAGGG)³ PNA Probe (Panagene) |
| Lipofectamine 3000 | High-efficiency transfection reagent for plasmid delivery into mammalian cells. | Thermo Fisher L3000001 |
| Live-Cell Imaging Chamber | Maintains temperature and CO₂ for live-cell FRAP and kinetic experiments. | Tokai Hit Stage Top Incubator |
| High-Fidelity DNA Polymerase | Amplifies sgRNA inserts for cloning with minimal errors. | Q5 Hot-Start Polymerase (NEB) |
| BbsI Restriction Enzyme | Creates Golden Gate compatible overhangs for sgRNA insertion into backbone. | BbsI-HF (NEB #R3539) |
| Image Analysis Software | Quantifies fluorescence intensity, foci count, and co-localization. | Fiji/ImageJ (Open Source) |
Optimal telomere targeting is achieved with truncated sgRNAs of 17-18 nucleotides, which provide an enhanced signal-to-noise ratio and longer residence time compared to full-length 20-nt guides. This protocol enables researchers to systematically optimize sgRNA parameters for high-resolution CRISPR imaging of telomere dynamics, supporting advanced studies in chromatin biology and telomere-targeted drug discovery.
Within CRISPR imaging research for chromatin and telomere visualization, a core challenge is balancing the expression of the catalytically dead Cas9 (dCas9) protein fused to fluorescent reporters. High expression is necessary to generate a detectable signal against genomic background noise. However, excessive dCas9, particularly when bound to numerous guide RNAs (gRNAs), can lead to cytotoxicity, off-target binding, and aberrant transcriptional effects, compromising experimental validity and cell health. This application note provides protocols and data for achieving this critical balance, framed within a thesis focusing on long-term, live-cell imaging of telomere dynamics.
Table 1: Comparative Analysis of dCas9 Expression Systems for Imaging
| Expression System | Typical Plasmid Backbone | Approx. dCas9-FP Copy/Cell | Relative Signal Intensity | Reported Toxicity Onset | Ideal Use Case |
|---|---|---|---|---|---|
| Strong Constitutive | CMV, EF1α | >10⁵ | Very High | 24-48 hrs (High gRNA#) | Fixed-cell imaging, short-term live imaging |
| Moderate Constitutive | PGK, SFFV | 10⁴ - 10⁵ | High | 48-72 hrs | General live-cell imaging (moderate labeling) |
| Inducible (Tight) | Dox-inducible (TRE3G) | Tunable (10³ - 10⁴) | Medium-High | Delayed >96 hrs | Long-term kinetics, sensitive cell lines |
| BAC Transgenesis | Bacterial Artificial Chromosome | 1-2 (at native locus) | Low-Medium | Minimal | Endogenous-level studies, very long-term imaging |
| mRNA Transfection | N/A | Transient (10³ - 10⁴) | Medium | Low (transient) | Primary/non-dividing cells, avoiding genomic integration |
Table 2: Impact of gRNA Array Size on Signal & Viability
| Number of Target Loci | Recommended gRNA Copies/Locus | Expected Signal Gain | Viability Drop (vs. Control) | Recommended dCas9 Expression Level |
|---|---|---|---|---|
| 1-5 (e.g., telomeres) | 2-4 | 3-8x | <10% | Moderate to High |
| 10-20 (chromatin loci) | 2 | 5-15x | 10-25% | Moderate |
| >40 (saturating) | 1 | High but saturated | 30-50%+ | Low (Inducible/Tight) |
Detailed Protocols
Protocol 1: Titrating dCas9 Expression via Inducible Systems
Aim: To establish a stable cell line with tunable dCas9-EGFP expression for optimal signal-to-toxicity ratio. Materials: TRE3G-dCas9-EGFP plasmid, rtTA-advanced plasmid, puromycin, doxycycline, fluorescence-activated cell sorter (FACS). Procedure:
- Co-transfect HEK293T or target cells with the inducible dCas9-EGFP plasmid and the rtTA-advanced transactivator plasmid.
- Select with puromycin (1-2 µg/mL) for 7 days to generate a polyclonal stable line.
- Seed cells and treat with a doxycycline gradient (0, 10, 50, 100, 500 ng/mL) for 48 hours.
- Analyze cells via flow cytometry for mean fluorescence intensity (MFI) and forward/side scatter (morphology proxy for health).
- Plot MFI vs. doxycycline concentration. Use Annexin V/PI staining to assess apoptosis at each dose.
- Determine the "sweet spot" concentration that yields ≥80% cell viability with a fluorescence signal 10-fold above autofluorescence. This dose is used for subsequent imaging experiments.
Protocol 2: Evaluating gRNA-Dependent Toxicity via Proliferation Assay
Aim: To quantify the impact of multiplexed gRNA expression on cell growth in the presence of dCas9. Materials: Stable dCas9-expressing cell line (from Protocol 1), lentiviral vectors encoding telomere-specific gRNA arrays (2, 4, or 8 gRNAs per array), CellTiter-Glo kit. Procedure:
- Transduce the stable dCas9 cell line with gRNA lentiviruses (MOI ~5) and select with blasticidin (5 µg/mL).
- Seed equal numbers of cells (from control and gRNA-expressing populations) in a 96-well plate.
- Induce dCas9 expression with the predetermined "sweet spot" doxycycline dose.
- At 0, 24, 48, 72, and 96 hours post-induction, lyse cells and measure ATP levels using the CellTiter-Glo kit as a proxy for viable cell number.
- Normalize luminescence to the 0-hour time point. A significant drop in proliferation rate in gRNA-expressing cells versus dCas9-only control indicates gRNA/dCas9 complex-mediated toxicity.
The Scientist's Toolkit: Research Reagent Solutions
Table 3: Essential Reagents for Balanced CRISPR Imaging
| Reagent/Material | Function & Rationale |
|---|---|
| TRE3G or similar inducible vector | Enables precise, tunable control of dCas9-FP expression levels to minimize basal toxicity. |
| Fluorescent Protein (FP): SunTag system | Amplifies signal without increasing dCas9 protein load. A single dCas9 binds 24x GFP, improving signal-to-noise. |
| MS2/PP7 RNA aptamer system | Converts gRNA into a scaffold for recruiting multiple FPs, offering an alternative signal amplification strategy. |
| Gibson Assembly master mix | For efficient cloning of repetitive gRNA arrays into expression vectors. |
| CellTiter-Glo 3D/2.0 Assay | Optimized for quantifying viability in 2D or 3D cultures post-CRISPR complex expression. |
| Annexin V-FITC/PI Apoptosis Kit | Directly measures early and late apoptosis induced by potential dCas9/gRNA overload. |
| Flow Cytometry Sorting (FACS) | Critical for isolating cell populations with optimal, non-toxic dCas9-FP expression levels. |
| Live-cell imaging-optimized media | Phenol-free, CO₂-independent media to maintain health during prolonged imaging sessions. |
Visualization of Key Concepts
Title: The Core Challenge of dCas9 Expression Balance
Title: Optimization Workflow for CRISPR Imaging
Advanced Fluorophore and Reporter Choices (e.g., HaloTag, Snap-tag) for Brighter Signals
Within the context of CRISPR-based imaging of chromatin dynamics and telomere visualization, achieving high signal-to-noise ratios is paramount. The fusion of CRISPR guide RNAs with engineered self-labeling protein tags, such as HaloTag and Snap-tag, provides a powerful platform for recruiting bright, synthetic fluorophores to specific genomic loci. This application note details the latest advances in fluorophore-reporter pairs and provides protocols for their implementation in live-cell imaging studies.
Comparison of Self-Labeling Tag Systems
Table 1: Quantitative Comparison of Key Self-Labeling Tag Systems
| Parameter | HaloTag | Snap-tag | CLIP-tag |
|---|---|---|---|
| Size (kDa) | 33 | 20 | 20 |
| Substrate | Chloroalkane | Benzylguanine (BG) | Benzylcytosine (BC) |
| Covalent Bond | Stable alkyl-thioether | Stable thioether | Stable thioether |
| Labeling Speed (kon, M-1s-1) | ~10^4 - 10^5 | ~10^3 - 10^4 | ~10^3 - 10^4 |
| Commercial Fluorophore Availability | Extensive (Janelia Fluor, etc.) | Extensive (TMR-Star, SiR, etc.) | Extensive |
| Key Advantage for Brightness | Accommodates cell-permeable, bright, photostable JF-dye ligands. | Orthogonal labeling with CLIP-tag enables multiplexing. | Orthogonality with Snap-tag. |
| Typical Background | Low with careful washing | Low with careful washing | Low with careful washing |
Table 2: Performance of Selected Fluorophores in Live-Cell CRISPR Imaging
| Fluorophore-Ligand | Tag | ε (M-1cm-1) | Φf | Brightness Index (ε * Φ) | Notes for Chromatin Imaging |
|---|---|---|---|---|---|
| JF549-HTL | HaloTag | 87,000 | 0.88 | ~76,560 | Excellent photostability; ideal for tracking telomere dynamics. |
| JF646-HTL | HaloTag | 152,000 | 0.54 | ~82,080 | Near-IR; reduced cellular autofluorescence. |
| SiR-Snap | Snap-tag | ~77,000 | 0.32 | ~24,640 | Far-red, low background. |
| TMR-Star | Snap-tag | 65,000 | 0.30 | ~19,500 | Standard green/red option. |
| LD655-BG | Snap-tag | 125,000 | 0.30 | ~37,500 | Bright far-red option from latest literature. |
Experimental Protocols
Protocol 1: CRISPR-SunTag with HaloTag for Telomere Visualization
This protocol uses a SunTag array to recruit multiple scFv-HaloTag fusions, amplifying signal at a telomeric locus labeled by dCas9.
Materials:
- Plasmid: pcDNA-dCas9-24xSunTag.
- Plasmid: scFv-GCN4-sfGFP-HaloTag (for simultaneous GFP and Halo imaging).
- Plasmid: pU6-Telomere sgRNA.
- HaloTag ligand of choice (e.g., JF549-HTL, Promega).
- Live-cell imaging medium (FluoroBrite DMEM + 10% FBS).
Method:
- Cell Seeding & Transfection: Seed HeLa or U2OS cells in a glass-bottom 35 mm dish. At 60-70% confluence, co-transfect the three plasmids using a suitable transfection reagent (e.g., Lipofectamine 3000). Use a 1:1:1 molar ratio (total 2 µg DNA).
- Expression: Incubate cells for 24-48 hours to allow robust expression of the CRISPR/Tag system.
- Labeling:
- Prepare a 1 µM working solution of the HaloTag ligand (e.g., JF549-HTL) in pre-warmed imaging medium.
- Replace culture medium with the ligand-containing medium. Incubate for 15 minutes at 37°C.
- Remove ligand medium and wash cells thoroughly 3x with fresh, pre-warmed medium containing a quenching agent (e.g., 1 µM HaloTag Janelia Fluor ligand for 30 min) to block unbound ligand and reduce background.
- Replace with fresh imaging medium for imaging.
- Imaging: Perform live-cell imaging on a confocal or widefield microscope with appropriate filter sets. For JF549, use 554/23 nm excitation and 609/54 nm emission. Acquire z-stacks every 15-30 minutes to monitor telomere dynamics.
Protocol 2: Multiplexed Imaging with Snap-tag and CLIP-tag
This protocol enables two-color imaging of distinct chromatin loci using orthogonal self-labeling tags.
Materials:
- Plasmid A: dCas9-24xSunTag-Snap-tag fusion.
- Plasmid B: scFv-GCN4-CLIP-tag fusion.
- Two sgRNAs targeting distinct genomic loci (e.g., telomere and a specific gene locus).
- Snap-tag ligand (e.g., LD655-BG, New England Biolabs).
- CLIP-tag ligand (e.g., CF488A-BC, Sigma).
- Live-cell imaging medium.
Method:
- Cell Seeding & Transfection: Seed cells and co-transfect Plasmid A, Plasmid B, and the two sgRNA plasmids.
- Dual-Labeling:
- Prepare a dual-labeling medium containing both ligands at 500 nM each in imaging medium.
- At 24-48 hours post-transfection, replace medium with dual-labeling medium. Incubate for 30 min at 37°C.
- Aspirate and wash cells 5x over 1 hour with fresh, pre-warmed medium to thoroughly remove unbound dyes.
- Imaging: Image using sequential acquisition to minimize crosstalk. For CF488A (CLIP-tag), use 488 nm ex/525 nm em. For LD655 (Snap-tag), use 640 nm ex/680 nm em.
Diagrams
Title: CRISPR-HaloTag Imaging Workflow
Title: SunTag HaloTag Signal Amplification
The Scientist's Toolkit
Table 3: Essential Research Reagent Solutions for CRISPR-Tag Imaging
| Reagent / Material | Supplier Examples | Function in Experiment |
|---|---|---|
| dCas9-SunTag Plasmid | Addgene (#111170) | CRISPR targeting module with peptide array for signal amplification. |
| scFv-GCN4-HaloTag Plasmid | Addgene (#104999) | Binds SunTag to recruit self-labeling HaloTag protein. |
| Janelia Fluor HaloTag Ligands (JF549, JF646) | Promega, Tocris | High-performance, cell-permeable, photostable fluorophores for bright labeling. |
| SNAP-Cell Ligands (SiR, TMR-Star) | New England Biolabs | Fluorescent substrates for specific, covalent Snap-tag labeling. |
| CLIP-Cell Ligands (CF488A) | Sigma-Aldrich | Orthogonal substrates for CLIP-tag; enables multiplexing with Snap-tag. |
| FluoroBrite DMEM | Thermo Fisher | Low-autofluorescence media for optimal live-cell imaging. |
| Glass-Bottom Dishes | MatTek, CellVis | High-quality substrate for high-resolution microscopy. |
| Lipofectamine 3000 | Thermo Fisher | High-efficiency transfection reagent for plasmid delivery. |
Protocols for Effective Signal Amplification (e.g., via SunTag or Hairpin Arrays)
Within the broader thesis investigating chromatin dynamics and telomere visualization using CRISPR-based imaging, a primary challenge remains the detection of low-abundance genomic loci. Conventional CRISPR/dCas9 systems fused to a single fluorescent protein often yield insufficient signal for reliable, high-resolution tracking. This necessitates robust signal amplification protocols. This document details application notes and validated protocols for two powerful amplification scaffolds: the SunTag system and CRISPR/dCas9-Hairpin Array systems, enabling sensitive, quantitative imaging of chromatin and telomeres.
Amplification Systems: Core Principles & Quantitative Comparison
SunTag System
The SunTag is a peptide array (typically 10x GCN4) fused to dCas9. Co-expression with a single-chain variable fragment (scFv) antibody fused to a fluorescent protein (e.g., sfGFP) results in the recruitment of multiple fluorophores per dCas9, amplifying the signal.
Hairpin Array System
This system employs dCas9 fused to an array of orthogonal RNA hairpins (e.g., MS2, PP7, boxB). Co-expression of matching RNA-binding proteins (MCP, PCP, λN22) fused to fluorophores enables multiplexed, orthogonal signal amplification at a single locus.
Table 1: Quantitative Comparison of Amplification Systems
| Parameter | SunTag (10xGCN4) | Hairpin Array (e.g., 24xMS2) |
|---|---|---|
| Theoretical Max Fluorophores/dCas9 | 10 | 24 (or 48 with dimeric MCP) |
| Typical Signal Gain vs. dCas9-FP | ~8-10 fold | ~20-40 fold |
| Background (Off-Target) | Moderate (scFv diffusion) | Low (high-affinity RNA binding) |
| Multiplexing Capacity | Low (one color) | High (2-3 colors with PP7, boxB) |
| Typical Construct Size (dCas9 fusion) | ~7.2 kb | ~8.5 kb (for 24xMS2) |
| Best Applications | Single-color, high-fidelity tracking | Multiplexing, ultra-sensitive detection |
Detailed Experimental Protocols
Protocol 1: SunTag System for Telomere Visualization
A. Plasmid Construction & Validation
- dCas9-SunTag Plasmid: Clone a mammalian expression plasmid encoding dCas9 fused to the 10xGCN4 peptide array and a nuclear localization signal (NLS).
- scFv-sfGFP Plasmid: Clone a plasmid encoding the anti-GCN4 scFv (single-chain antibody fragment) fused to superfolder GFP (sfGFP) and an NLS.
- sgRNA Plasmid: Clone a U6 promoter-driven expression plasmid for your target-specific sgRNA (e.g., targeting the human telomeric repeat
TTAGGG).
B. Cell Culture & Transfection
- Seed HeLa or U2OS cells in a glass-bottom imaging dish at 60-70% confluency.
- Co-transfect using a lipofectamine-based reagent with the following plasmid ratio:
- dCas9-SunTag: 1 µg
- scFv-sfGFP: 1.5 µg
- Telomere-targeting sgRNA: 1 µg
- Optional: Include a plasmid expressing a fluorescent nuclear marker (e.g., H2B-mCherry) for segmentation.
- Incubate cells for 16-24 hours before imaging.
C. Live-Cell Imaging & Analysis
- Imaging Medium: Use phenol-free medium supplemented with 10% FBS and 25mM HEPES.
- Microscope Settings: Use a confocal or widefield microscope with a 63x or 100x oil objective. For sfGFP, use 488 nm excitation.
- Acquisition: Capture z-stacks (0.5 µm steps) encompassing the entire nucleus. Limit exposure to minimize photobleaching.
- Analysis: Use FIJI/ImageJ to generate maximum intensity projections. Quantify telomere spot intensity and count using spot-detection algorithms (e.g., TrackMate).
Protocol 2: Multiplexed Imaging with Hairpin Arrays
A. Plasmid Construction for Two-Color Imaging
- Targeting Complex (Locus 1): Construct
dCas9-24xMS2and a matching sgRNA with two MS2 hairpins in its tetraloop and stem-loop 2. - Labeling Protein (Locus 1): Construct
MCP-sfGFP(MCP coat protein fused to sfGFP). - Targeting Complex (Locus 2): Construct
dCas9-24xPP7and a matching, orthogonal sgRNA with PP7 hairpins. - Labeling Protein (Locus 2): Construct
PCP-mCherry(PCP coat protein fused to mCherry).
B. Cell Culture & Sequential Transfection
- Seed cells as in Protocol 1.
- Day 1: Transfect with
dCas9-24xMS2,sgRNA-MS2,dCas9-24xPP7, andsgRNA-PP7plasmids. - Day 2: Transfect with
MCP-sfGFPandPCP-mCherryplasmids. This staggered transfection improves signal-to-noise. - Incubate for an additional 12-16 hours.
C. Imaging & Demultiplexing
- Microscope Settings: Sequential acquisition using 488 nm (sfGFP) and 561 nm (mCherry) lasers to avoid cross-talk.
- Control: Image cells expressing only the MCP-sfGFP or PCP-mCherry to check for non-specific recruitment.
- Analysis: Colocalization analysis (e.g., Pearson's coefficient) can be performed to study inter-locus interactions.
Mandatory Visualizations
Diagram 1: SunTag Amplification Workflow
Diagram 2: Hairpin Array Multiplexed Imaging
The Scientist's Toolkit: Research Reagent Solutions
Table 2: Essential Materials and Reagents
| Item Name | Function & Role in Protocol | Example Source/Catalog # |
|---|---|---|
| dCas9-SunTag (10xGCN4) Plasmid | Core targeting module for SunTag amplification. | Addgene #60903 |
| scFv-sfGFP Plasmid | Antibody-fluorophore fusion that binds GCN4 peptides for signal multiplication. | Addgene #60905 |
| dCas9-24xMS2 Plasmid | Core targeting module for MS2-based hairpin amplification. | Addgene #104325 |
| MCP-sfGFP / PCP-mCherry Plasmids | RNA-binding proteins fused to fluorophores for hairpin system signal generation. | Addgene #104326 / #104327 |
| Telomere-Targeting sgRNA Plasmid | Guides dCas9 to repetitive telomeric sequences for visualization. | Custom design, Clone into Addgene #53188 |
| Lipofectamine 3000 | High-efficiency transfection reagent for plasmid delivery into mammalian cells. | Thermo Fisher L3000001 |
| Glass-Bottom Dishes (35mm) | High-quality optical substrate for high-resolution live-cell microscopy. | CellVis D35-20-1.5-N |
| HEPES Buffer (1M) | Maintains physiological pH during live-cell imaging outside a CO2 incubator. | Gibco 15630080 |
| U2OS Cell Line | Human bone osteosarcoma cells; large nucleus, excellent for chromatin imaging studies. | ATCC HTB-96 |
Mitigating Photobleaching and Phototoxicity During Long-Term Live-Cell Imaging
Within CRISPR imaging research for chromatin and telomere visualization, long-term live-cell imaging is essential to capture dynamic genomic processes. However, photobleaching of fluorescent proteins and dyes, and phototoxicity from excessive light exposure, compromise cell viability and data integrity. These challenges are acute in experiments using CRISPR/dCas9 systems fused to fluorescent reporters (e.g., GFP, mCherry) to track genomic loci over hours or days. This guide presents current protocols and reagents to minimize these detrimental effects.
Core Principles of Photoprotection
Quantitative Impact of Phototoxicity
The table below summarizes key factors and their quantitative impact on cell health and signal integrity.
Table 1: Quantitative Effects of Imaging Parameters on Photodamage
| Parameter | Typical High-Risk Value | Recommended Safer Range | Measurable Impact (Example) |
|---|---|---|---|
| Illumination Intensity | 10-100 mW/cm² | 0.5-5 mW/cm² | Viability drop to <50% after 2 hrs at high intensity |
| Exposure Time | 500 ms | 50-200 ms | ~5x reduction in photobleaching rate |
| Time Interval | 10 sec | 1-5 min | ROS levels maintained near basal |
| Wavelength | <450 nm (UV/Blue) | >500 nm (Green/Red) | 3-5x increase in cell survival with longer wavelengths |
| Cumulative Dose | >50 J/cm² | <10 J/cm² | Severe mitochondrial dysfunction above threshold |
Key Research Reagent Solutions
Table 2: Essential Reagents for Mitigating Photodamage in Live-Cell CRISPR Imaging
| Reagent/Category | Example Products | Primary Function in Mitigation |
|---|---|---|
| Oxygen Scavengers | Oxyrase, Pyranose Oxidase/Catalase, Glucose Oxidase/Catalase | Reduces dissolved oxygen, lowering ROS generation and photobleaching. |
| Triplet State Quenchers | Trolox, Ascorbic Acid, Cyclooctatetraene (COT) | Quenches excited triplet states of fluorophores, preventing bleaching & ROS. |
| Mounting Media Additives | Commercial: ProLong Live, SlowFade, Nail Polish. Homebrew: GLOX (Glucose Oxidase + Catalase) in imaging medium. | Maintains a reducing environment during imaging on the microscope stage. |
| Genetically Encoded Fluorophores | mScarlet, mNeonGreen, HaloTag/SNAP-tag with Janelia Fluor dyes. | Brighter, more photostable fluorophores for CRISPR/dCas9 fusions reduce required excitation power. |
| ROS Scavengers | N-Acetyl Cysteine (NAC), Reduced Glutathione | Directly neutralizes reactive oxygen species generated during imaging. |
| Photosensitizer Reducers | Histidine, Deuterium Oxide (D₂O) | Reduces the lifetime of singlet oxygen and other photosensitized products. |
Detailed Application Notes and Protocols
Protocol 1: Preparing an Anti-Fading Imaging Chamber for Long-Term CRISPR Imaging
This protocol creates a sealed, physiological environment that minimizes photobleaching.
Materials:
- 35mm glass-bottom imaging dish (e.g., MatTek P35G-1.5-14-C).
- CRISPR-labeled cells (e.g., dCas9-EGFP for telomere visualization).
- Imaging Medium: FluoroBrite DMEM supplemented with 10% FBS, 1% GlutaMAX, and 25mM HEPES.
- GLOX Oxygen Scavenging System: Prepare fresh: 1 mg/mL Glucose Oxidase, 0.1 mg/mL Catalase, and 0.5% (w/v) D-Glucose in imaging medium.
- Triplet Quencher Stock: 1M Trolox in DMSO (store at -20°C).
- Vacuum grease or VALAP.
Procedure:
- Cell Preparation: Seed cells expressing dCas9-fluorescent protein fusions with appropriate sgRNAs targeting telomeres or chromatin loci 24-48 hours prior.
- Medium Exchange: Just before imaging, replace culture medium with 2 mL of Imaging Medium.
- Add Scavengers/Quenchers: Add GLOX solution to a final concentration of ~1x and Trolox to a final concentration of 1-2 mM. Mix gently.
- Seal the Chamber: For time-lapses >1 hour, apply a thin bead of vacuum grease around the rim of the glass insert. Carefully place a #1.5 coverslip on top to seal, excluding air bubbles. Alternatively, use VALAP to seal edges.
- Equilibrate: Place dish in microscope environmental chamber (37°C, 5% CO₂) for 15-20 minutes before starting acquisition.
Protocol 2: Optimizing Microscope Parameters for Minimal Photodamage
A systematic approach to setting up acquisition software for long-term health of CRISPR-imaged cells.
Workflow:
- Find Minimal Laser Power: Start with the lowest possible laser intensity (e.g., 0.5% for a 488nm laser) and maximum camera gain. Gradually increase laser power until you achieve a signal-to-noise ratio (SNR) >5 for your target structure (e.g., a telomere cluster).
- Optimize Exposure Time: With the laser power set, reduce camera exposure time to the minimum that maintains the target SNR. Aim for <200ms.
- Use Hardware-Based Sensitivity: Employ Highly Sensitive Detectors (e.g., sCMOS, EM-CCD) to collect more photons per unit excitation.
- Expand Detection Bandwidth: Widen emission filters (e.g., 525/50nm instead of 525/25nm) to collect more signal without increasing light dose.
- Implement Hardware Activation: Use AOTF/ACOUSTO-OPTIC TUNABLE FILTER or LED illumination systems for precise, fast control of light pulses, eliminating unnecessary exposure during readout.
- Leverage Advanced Acquisition Modes: If available, use RESOLFT, Light Sheet Microscopy, or Two-Photon Microscopy for inherent optical sectioning and reduced out-of-focus exposure.
Diagram 1: Workflow for Microscope Parameter Optimization
Protocol 3: Validating Cell Health Post-Imaging
Essential controls to confirm that mitigation strategies preserve normal cell function.
Methodology:
- Control Groups: Include non-imaged control cells from the same dish and cells imaged with a "high-dose" (standard) protocol.
- Viability Staining: Immediately after time-lapse, add 1 µM Calcein AM (viability, green) and 1 µM Ethidium Homodimer-1 (death, red) to the medium. Incubate 15-30 min at 37°C. Image at low light.
- Quantification: Calculate viability as (Calcein+ cells) / (Total cells) x 100. Successful mitigation yields viability >90%, comparable to non-imaged controls.
- Proliferation Assay: Re-plate imaged cells at low density and count colonies or use an Incucyte system to track confluency over 48-72 hours. Delay >20% compared to control indicates residual phototoxicity.
- Morphological Indicators: Analyze time-lapse images for signs of stress: excessive cytoplasmic vacuolization, nuclear condensation, or blebbing.
Integrated Strategy for CRISPR Imaging Experiments
The following diagram integrates reagent choice and protocol steps into a cohesive strategy for a multi-hour chromatin tracking experiment.
Diagram 2: Integrated Strategy for Long-Term CRISPR Imaging
Successful long-term live-cell imaging of CRISPR-labeled chromatin and telomeres requires a multi-pronged approach combining reagent-based photoprotection, rigorous microscope optimization, and post-imaging validation. Implementing the protocols and using the reagents detailed here allows researchers to extend imaging windows significantly while preserving physiological relevance—a critical advancement for dynamic genomic studies.
Application Notes and Protocols Within the context of CRISPR imaging for chromatin and telomere visualization, accurate quantification of telomere length and fluorescence spot intensity is paramount. Common pitfalls include inconsistent segmentation, improper background subtraction, and normalization errors, which can lead to misleading biological conclusions in drug screening and mechanistic studies. These notes address key challenges and provide standardized protocols.
Quantitative Data Summary: Common Pitfalls and Correction Factors
Table 1: Primary Sources of Error in Telomere Quantification via Fluorescence Imaging
| Pitfall Category | Typical Error Magnitude | Recommended Correction Method | Impact on Drug Studies |
|---|---|---|---|
| Background Heterogeneity | Intensity variance up to 40% | Per-cell rolling-ball or local median subtraction | Can obscure drug-induced shortening/elongation |
| Spot Segmentation | False negative rate: 10-25% | Laplacian of Gaussian (LoG) detection + size filter | Misestimates telomere number & length distribution |
| Photobleaching | Intensity loss of 1-5% per frame | Pre-imaging calibration & correction factor | Confounds time-course analyses |
| Channel Crosstalk | 3-15% signal bleed-through | Spectral unmixing with reference controls | False co-localization in multiplexed CRISPR imaging |
| Normalization | Arbitrary unit shifts | Use of internal reference (e.g., centromere probe) | Enables cross-experiment & cross-platform comparison |
Experimental Protocols
Protocol 1: CRISPR Live-Cell Telomere Labeling and Image Acquisition for Intensity Quantification Objective: To generate consistent, high signal-to-noise ratio images of telomeres for reliable spot intensity measurement.
- Cell Preparation: Seed Hela or U2OS cells in glass-bottom dishes. Transfect with dCas9-EGFP and a pool of telomere-specific sgRNAs (repeat sequence:
TTAGGG). - Live-Cell Imaging: 48h post-transfection, replace medium with phenol red-free, CO₂-independent imaging medium. Maintain temperature at 37°C.
- Acquisition Parameters (Confocal Microscope):
- Use a 63x or 100x oil-immersion objective (NA ≥1.4).
- Set excitation/emission for EGFP (488 nm/500-550 nm).
- Set pixel size to 80-100 nm (Nyquist sampling).
- Use identical laser power, gain, and exposure time across all samples within an experiment.
- Acquire Z-stacks (0.5 µm steps) to capture entire telomere volume.
- Control Sample: Include cells labeled with a non-targeting sgRNA to define background autofluorescence.
Protocol 2: Image Analysis Workflow for Telomere Spot Intensity and Length Proxy Objective: To accurately segment telomere spots, measure integrated intensity (proxy for length), and normalize data.
- Preprocessing (FIJI/ImageJ):
- Apply a Gaussian blur (σ=1 pixel) to reduce noise.
- Subtract background using the "Rolling Ball" algorithm (radius = 50 pixels for whole cell, 5 pixels for local telomere region).
- Spot Detection:
- Use the "Find Maxima" function with a prominence threshold set relative to the non-targeting control sample, or employ a Laplacian of Gaussian (LoG) 3D spot detector.
- Apply a size filter (0.01 - 0.5 µm² in area) to exclude non-specific aggregates.
- Intensity Measurement:
- For each detected spot, measure the Integrated Density (sum of pixel intensities) within a fixed-diameter circular ROI (e.g., 5-pixel radius) centered on the spot maximum.
- Record the local background intensity from an annulus around each spot.
- Corrected Intensity = Integrated Density - (Area of ROI * Mean Local Background).
- Normalization:
- Normalize corrected intensities to an internal control, such as the median intensity of centromere spots labeled with a separate dCas9-fluorophore in the same cell.
- Express final values as normalized intensity units (NIU).
Mandatory Visualization
Title: Workflow for Accurate Telomere Intensity Quantification
Title: Pitfall Analysis: Cause, Effect, and Solution
The Scientist's Toolkit: Research Reagent Solutions
Table 2: Essential Materials for CRISPR Telomere Imaging & Quantification
| Item | Function in Experiment | Key Consideration for Quantification |
|---|---|---|
| dCas9-Fluorophore Fusion Protein (e.g., dCas9-EGFP) | CRISPR-based label for imaging endogenous telomeric DNA sequences. | Photostability and maturation time affect intensity linearity. Use bright, monomeric fluorophores. |
| Telomere-Targeting sgRNA Pool (TTAGGG repeat) | Guides dCas9 to telomeres. A pool ensures robust, multi-plexed labeling for bright spots. | Ensures consistent labeling density across samples, critical for intensity comparisons. |
| Non-Targeting Control sgRNA | Defines background fluorescence levels for threshold setting. | Essential for calculating the signal-to-noise ratio and setting detection limits. |
| Reference Probe (e.g., Centromere-specific sgRNA with dCas9-mCherry) | Provides an internal intensity standard within the same cell for normalization. | Controls for cell-to-cell variation in expression and imaging conditions. |
| Glass-Bottom Culture Dishes | Provides optimal optical clarity for high-resolution imaging. | Inconsistent substrate thickness can distort intensity measurements. |
| Phenol Red-Free Imaging Medium | Reduces background autofluorescence during live-cell acquisition. | Critical for maximizing the dynamic range of detected spot intensity. |
| Calibration Beads (Fluorescent) | Verify microscope laser stability and detector linearity across experiments. | Allows for cross-day intensity calibration, mitigating instrumental drift. |
Benchmarking CRISPR Imaging: How Does It Stack Up Against FISH, TALE, and Hi-C?
Within the broader thesis on CRISPR imaging for chromatin and telomere visualization, a central challenge is benchmarking novel CRISPR-based techniques against established gold standards. This application note provides a direct comparison between modern CRISPR imaging (e.g., CRISPRainbow, Cas9-sgRNA-dye complexes) and conventional fluorescence in situ hybridization (FISH) methods for DNA and RNA. The focus is on critical parameters for live-cell and fixed-sample analysis in drug development research, such as spatial resolution, multiplexing capability, specificity, and experimental throughput.
Quantitative Comparison Table
Table 1: Performance Comparison of Imaging Modalities
| Parameter | DNA-FISH | RNA-FISH (e.g., smFISH) | CRISPR Imaging (Live/Targeted) |
|---|---|---|---|
| Spatial Resolution | ~10-50 nm (Super-resolution variants) | ~20-50 nm (for single RNA molecules) | ~200-500 nm (Diffraction-limited) |
| Specificity (Background) | High, but can suffer from probe accessibility issues | Very High (multiple short probes per transcript) | Moderate to High (dependent on sgRNA design & delivery) |
| Multiplexing Capacity | Moderate (4-5 colors with spectral imaging) | High (7+ targets with sequential barcoding) | High (Theoretical: 7+ with combinatorial labeling) |
| Live-Cell Capability | No (Requires fixation and denaturation) | No (Fixed samples only) | Yes (Catalytically dead Cas9 fused to fluorescent proteins) |
| Sample Preparation Time | Long (Overnight hybridization typical) | Long (Overnight hybridization typical) | Short to Moderate (Transfection followed by 24-48h expression) |
| Throughput | Low (Manual, lengthy protocol) | Low to Moderate | Moderate to High (Amenable to time-lapse) |
| Primary Application | Mapping genomic loci, chromosomal abnormalities | Quantifying RNA expression & localization | Dynamic tracking of genomic loci, live chromatin imaging |
Experimental Protocols
Protocol A: Multiplexed DNA-FISH for Telomere Visualization
Objective: To visualize and quantify telomere length and distribution in fixed cells.
- Cell Preparation: Culture cells on chambered slides. Fix with 4% paraformaldehyde (PFA) for 10 min at room temperature (RT). Permeabilize with 0.5% Triton X-100 for 15 min.
- Denaturation & Hybridization: Incubate slides in 70% formamide/2x SSC at 75°C for 5 min to denature DNA. Immediately dehydrate in cold ethanol series (70%, 85%, 100%).
- Probe Application: Apply commercially available Cy3-labeled (CCCTAA)3 PNA Telomere Probe. Coverslip and seal with rubber cement.
- Hybridization: Denature probe+cells at 80°C for 5 min, then hybridize in a dark humid chamber at 37°C for 2 hours.
- Washing: Remove coverslip and wash twice in 70% formamide/2x SSC (pH 7.5) for 15 min at 45°C, followed by three washes in 2x SSC at 45°C for 5 min each.
- Counterstaining & Imaging: Stain DNA with DAPI (300 nM) for 10 min. Mount and image using a super-resolution microscope (e.g., SIM or STORM).
Protocol B: Live-Cell CRISPR Imaging of Telomeres
Objective: To dynamically track telomere positions in living cells.
- sgRNA Design & Cloning: Design sgRNAs targeting the telomeric repeat (TTAGGG)n. Clone into a plasmid expressing both the sgRNA and an mCherry fluorescent reporter.
- Cell Transfection: Co-transfect HeLa or U2OS cells with the sgRNA plasmid and a plasmid expressing dCas9 fused to EGFP (dCas9-EGFP) using a lipid-based transfection reagent. Incubate for 24-48h.
- Imaging Preparation: Replace medium with pre-warmed, phenol-red-free imaging medium.
- Live-Cell Imaging: Use a confocal or widefield microscope with an environmental chamber (37°C, 5% CO2). Acquire time-lapse images (e.g., every 10-30 minutes for 24 hours) of the EGFP (telomere) and mCherry (transfection marker) channels.
- Analysis: Use particle tracking software (e.g., TrackMate in Fiji) to quantify telomere dynamics, speed, and trajectories.
Diagrams
Title: Imaging Method Selection Workflow for Chromatin Research
Title: CRISPR Imaging Complex Assembly and Targeting
The Scientist's Toolkit: Research Reagent Solutions
Table 2: Essential Reagents for Chromatin Visualization Experiments
| Reagent/Material | Function & Application |
|---|---|
| PNA Telomere FISH Probes | Cy3- or FITC-labeled peptide nucleic acid probes for high-specificity telomere FISH. |
| dCas9-EGFP Expression Plasmid | Expresses nuclease-dead Cas9 fused to EGFP for live-cell CRISPR imaging. |
| Lipofectamine 3000 | Lipid-based transfection reagent for delivering plasmids and RNPs into mammalian cells. |
| Formamide (Molecular Biology Grade) | Key component of FISH hybridization buffers for DNA denaturation. |
| SlowFade Gold Antifade Mountant | Preserves fluorescence during fixed-sample imaging, reduces photobleaching. |
| Super-Resolution Microscope | System (e.g., SIM, STORM) required to achieve <100 nm resolution for FISH validation. |
| sgRNA Synthesis Kit | For in vitro transcription or chemical synthesis of high-purity sgRNAs for RNP formation. |
| Phenol-Red Free Imaging Medium | Optimized medium for live-cell fluorescence imaging, minimizing background fluorescence. |
This application note details the critical advantages of live-cell cytogenetic analysis over traditional fixed-cell methods, with specific application to CRISPR-based imaging of chromatin dynamics and telomere biology. The ability to monitor genomic loci and nuclear architecture in real time provides unparalleled insights into temporal dynamics, functional responses, and heterogeneity within cell populations, which are lost in static, fixed-endpoint assays. Within the context of CRISPR imaging research, live-cell analysis transforms our understanding of genomic stability, gene regulation, and the mechanisms of therapeutic intervention.
Table 1: Comparative Analysis of Fixed vs. Live-Cell Cytogenetic Methods
| Parameter | Fixed-Cell Analysis | Live-Cell Dynamic Analysis | Quantitative Impact/Example |
|---|---|---|---|
| Temporal Resolution | Single time point (Static) | Continuous (Seconds to Days) | Enables measurement of telomere coalescence kinetics (e.g., events/hr) |
| Cellular Heterogeneity | Inferred from population snapshots | Directly observed in single cells | Reveals subpopulations with distinct telomere motion (~20% of cells show anomalous dynamics) |
| Data Dimensionality | 2D (x, y) or 3D (x, y, z) | 4D (x, y, z, time) + Intensity | Tracks >50 telomeres/cell over 24h, generating >1000 trajectories per experiment |
| Artifact Introduction | Fixation/permeabilization artifacts (shrinkage, extraction) | Minimal (from fluorescent tagging/illumination) | Fixation can alter nuclear volume by 10-30%, distorting spatial relationships |
| Functional Correlation | Indirect (correlative) | Direct (causative & kinetic) | Links telomere movement speed (e.g., 0.1-0.5 µm/min) to phase of cell cycle |
| Drug Response Analysis | Endpoint viability/ morphology | Real-time kinetic response & mechanism | Measures drug-induced telomere clustering onset within 60-120 min of treatment |
Application Protocols for Live-Cell CRISPR Imaging
Protocol 1: Live-Cell Labeling of Telomeres with CRISPR/dCas9 for Dynamic Tracking
Objective: To genetically label telomeric repeats in living cells for long-term imaging of their spatial dynamics and interactions.
Research Reagent Solutions:
- dCas9 Fusion Protein: dCas9 fused to a bright, photostable fluorescent protein (e.g., dCas9-SunTag-12xGCN4 or dCas9-EGFP). Function: Targetable scaffold for guide RNA binding without cleavage.
- Telomere-specific sgRNA: sgRNA with sequence targeting TTAGGG repeats, expressed from a Pol III promoter (U6). Function: Delivers dCas9 fusion to telomeric loci.
- Scaffold for Signal Amplification (Optional): SunTag system (scFv-GFP) or MS2/MCP system. Function: Amplifies fluorescence signal for detection of single loci.
- Low-Fluorescence, CO₂-Independent Live-Cell Imaging Medium: Function: Maintains cell health during extended imaging with minimal background.
- Genome-Safe Nuclear Stain (e.g., SiR-DNA): Function: Low-toxicity dye for visualizing nuclear boundary and cell cycle stage.
Methodology:
- Cell Preparation: Seed appropriate cells (e.g., U2OS, HeLa) stably expressing the dCas9-fluorophore fusion into a glass-bottom 35 mm imaging dish 24-48h prior.
- Transfection: Transfect with plasmid encoding the telomere-specific sgRNA using a low-toxicity transfection reagent. For signal amplification systems, also transfert the scFv-fluorophore or MCP-fluorophore component.
- Expression & Labeling: Allow 24-48h for robust expression and chromatin labeling.
- Imaging Setup: Replace medium with pre-warmed live-cell imaging medium. For long-term imaging (>6h), use an environmental chamber maintaining 37°C.
- Acquisition Parameters: Use a widefield or spinning-disk confocal microscope. Acquire z-stacks (5-7 slices, 0.5 µm step) every 5-15 minutes for 24-48 hours using a 60x or 100x oil objective. Use minimal laser power and exposure times to reduce phototoxicity.
Protocol 2: Quantifying Drug-Induced Telomere Dynamics in Live Cells
Objective: To measure changes in telomere motion and clustering in response to DNA damage or chromatin-modifying drugs.
Research Reagent Solutions:
- Live-Cell CRISPR Telomere-labeled Cells: From Protocol 1.
- Small Molecule Inhibitors: e.g., ATM/ATR inhibitors (KU-55933, VE-822), PARP inhibitors (Olaparib), or HDAC inhibitors (SAHA).
- DNA Damage Inducer (Positive Control): e.g., Bleomycin or Etoposide.
- Analysis Software: TrackMate (Fiji/ImageJ) or commercial particle tracking software.
Methodology:
- Baseline Imaging: Image telomere-labeled cells for 2-4 hours to establish baseline dynamics.
- Drug Perturbation: Gently add drug (or vehicle control) directly to the imaging medium at a pre-determined concentration without moving the dish. Use a syringe pump for ultra-gentle addition if required.
- Continuous Post-Treatment Imaging: Immediately resume time-lapse imaging for an additional 12-24 hours.
- Image Analysis & Quantification:
- Preprocessing: Perform background subtraction and correct for minor drift.
- Telomere Detection & Tracking: Use the TrackMate plugin to detect bright telomere spots and link them across frames to generate trajectories.
- Key Metrics Calculation:
- Mean Square Displacement (MSD): Calculate for each trajectory to determine diffusion coefficient and motion type (confined, Brownian, directed).
- Inter-Telomere Distance: Measure distances between all detected telomeres in each nucleus over time to quantify clustering events (distances <0.5 µm).
- Nuclear Zone-Specific Analysis: Divide the nucleus into sub-volumes (periphery, nucleolar vicinity) and analyze motion parameters in each zone separately.
Visualizing Workflows and Biological Relationships
Live-Cell vs Fixed-Cell Experimental Workflow
Live Imaging Reveals Drug Mechanism of Action
The Scientist's Toolkit: Key Reagents for Live-Cell CRISPR Cytogenetics
Table 2: Essential Research Reagent Solutions
| Reagent Category | Specific Example | Function in Live-Cell Analysis |
|---|---|---|
| CRISPR Imaging Platform | dCas9-EGFP + SunTag system (scFv-mCherry) | Enables bright, specific labeling of repetitive DNA sequences (telomeres, centromeres) for tracking. |
| Cell Health & Viability | Incucyte Cytoplasm Dye (NucLight reagents) | Allows concurrent quantification of cell proliferation/viability and targeted genomic imaging. |
| DNA Damage Reporter | Fluorescent PARP1 or 53BP1 biosensors | Provides real-time, spatial readout of DNA damage induction and repair relative to labeled loci. |
| Chromatin State Probes | Live-cell compatible H2B or HP1 fusion proteins | Visualizes global chromatin context and compartmentalization during dynamic events. |
| Metabolic Support | Glucose/Oxamate supplement in imaging media | Reduces background fluorescence (pH shifts) and supports cells during extended imaging. |
| Photoprotection | Oxyrase or Trolox-based scavengers | Mitigates phototoxicity and radical formation, enabling longer time-lapse experiments. |
Within the broader thesis on CRISPR-based imaging of chromatin architecture, precise quantification of sub-chromosomal structures is paramount. Telomeres, as protective caps of chromosomes, serve as critical indicators of genomic stability and cellular aging. Accurate telomere length measurement is therefore essential for research in senescence, oncology, and CRISPR-mediated genome editing outcomes. This Application Note provides a comparative analysis of two gold-standard quantitative fluorescence in situ hybridization (FISH) techniques—quantitative FISH (Q-FISH) and flow cytometry-FISH (Flow-FISH)—framing their utility in validating CRISPR imaging protocols for telomere visualization.
Q-FISH utilizes metaphase chromosome spreads or interphase nuclei on a slide, hybridized with a fluorescently-labeled (CCCTAA)n peptide nucleic acid (PNA) probe. Telomere fluorescence intensity is measured via digital microscopy, providing length data at the single-telomere and single-cell level with high spatial resolution.
Flow-FISH involves hybridization of the PNA probe to telomeric repeats in a suspension of permeabilized cells, followed by flow cytometry analysis. It measures the average telomere fluorescence per cell, enabling high-throughput population analysis but losing individual telomere data.
Quantitative Data Comparison
Table 1: Comparative Performance Metrics of Q-FISH and Flow-FISH
| Parameter | Q-FISH | Flow-FISH | Notes |
|---|---|---|---|
| Output Data | Length of individual telomeres; distribution per cell. | Average telomere length per cell for a population. | Q-FISH reveals heterogeneity; Flow-FISH gives population mean. |
| Throughput | Low to Moderate (10² - 10³ cells/experiment). | High (10⁴ - 10⁵ cells/experiment). | Flow-FISH is suited for large-scale screening studies. |
| Resolution | ~0.2 kb (on metaphase spreads). | ~0.5 kb (population average). | Q-FISH is more sensitive for detecting short telomeres. |
| Sample Type | Adherent cells, tissue sections, metaphase spreads. | Cell suspensions (blood lymphocytes, cultured cells). | Q-FISH is versatile for fixed archival samples. |
| Key Advantage | Single-telomere resolution, spatial context. | High-throughput, statistical power. | Complementary strengths. |
| Typical CV (Coefficient of Variation) | 5-10% (intra-slide). | 2-5% (inter-assay, for cell lines). | Flow-FISH can offer excellent reproducibility. |
| Integration with CRISPR Imaging | Direct correlation of telomere length with localization of dCas9-fluorescent fusions. | High-throughput screening of telomere length changes post-CRISPR perturbation. | Both enable functional genomics in telomere research. |
Table 2: Resource and Time Investment
| Stage | Q-FISH Protocol Duration | Flow-FISH Protocol Duration |
|---|---|---|
| Sample Preparation | 1-2 days (including metaphase arrest if needed). | 1 day (cell suspension preparation). |
| Hybridization & Washing | Overnight (~16 hrs) + 1 day. | ~4 hours + Overnight (~16 hrs). |
| Imaging/Analysis | 1-2 days (manual/automated microscopy). | 1-2 hours (flow cytometry run + analysis). |
| Total Hands-on Time | ~12-16 hours | ~6-8 hours |
| Total Elapsed Time | 3-4 days | 2 days |
Detailed Experimental Protocols
Protocol 4.1: Q-FISH on Metaphase Chromosomes
Objective: To obtain absolute telomere length measurements from individual chromosome ends.
Materials: See "Scientist's Toolkit" (Section 6). Procedure:
- Cell Culture & Metaphase Arrest: Grow cells to ~70% confluence. Add colcemid (0.1 µg/mL) for 2-4 hours to arrest cells in metaphase.
- Hypotonic Treatment & Fixation: Harvest cells by trypsinization. Resuspend pellet in pre-warmed 75mM KCl (hypotonic solution) and incubate at 37°C for 20 minutes. Add freshly prepared Carnoy's fixative (3:1 methanol:acetic acid) dropwise while vortexing gently. Centrifuge and resuspend in fixative. Repeat 3x.
- Slide Preparation: Drop fixed cell suspension onto clean, wet glass slides. Air dry and age slides for 3-7 days or bake at 60°C for 2 hours.
- PNA Probe Hybridization:
- Prepare hybridization mix: 70% deionized formamide, 10mM Tris pH 7.5, 0.5% blocking reagent, 1 µg/mL Cy3-(CCCTAA)₃ PNA probe.
- Denature slides in 70% formamide/2x SSC at 80°C for 3 minutes. Dehydrate in ethanol series (70%, 90%, 100%).
- Apply hybridization mix, add coverslip, and hybridize in a dark, humid chamber at room temperature for 2 hours.
- Post-Hybridization Washes:
- Wash 2x 15 min in 70% formamide/10mM Tris pH 7.5 at room temperature.
- Wash 3x 5 min in PBS/Tween 20 (0.1%).
- Counterstaining & Mounting: Stain chromosomes with DAPI (0.1 µg/mL in PBS). Mount with anti-fade mounting medium.
- Image Acquisition & Analysis: Use a fluorescence microscope with a CCD camera. Capture images of metaphase spreads using constant exposure times for Cy3 (telomeres) and DAPI (chromosomes). Use specialized software (e.g., Telometer, TFL-Telo) to quantify integrated fluorescence intensity of each telomeric spot. Convert fluorescence to kilobases using fluorescence standards (e.g., cells with known telomere length).
Protocol 4.2: Flow-FISH for Cell Suspensions
Objective: To determine the average telomere length in a large population of cells.
Materials: See "Scientist's Toolkit" (Section 6). Procedure:
- Cell Preparation: Create a single-cell suspension (e.g., from cultured cells or isolated lymphocytes). Count and aliquot ~1x10⁶ cells per experimental tube. Include control cells with known long (e.g., 1301 cell line) and short telomeres.
- Hybridization:
- Pellet cells and resuspend in hybridization mix: 70% deionized formamide, 20mM Tris pH 7.0, 1% BSA, 0.3 µg/mL FITC-(CCCTAA)₃ PNA probe.
- Denature samples at 85°C for 15 minutes in a thermal cycler or water bath.
- Hybridize in the dark at room temperature for 2 hours with gentle agitation.
- Post-Hybridization Washes:
- Add 1mL of wash buffer 1 (70% formamide, 10mM Tris pH 7.5, 0.1% BSA) and centrifuge. Repeat 2x.
- Resuspend in wash buffer 2 (PBS, 0.1% BSA, 0.1% Tween 20). Centrifuge and repeat.
- Counterstaining & DNA Stain: Resuspend pellet in PBS containing RNase A (0.1 mg/mL) and incubate at 37°C for 1 hour. Stain DNA with a far-red fluorescent dye (e.g., TO-PRO-3 or DAPI) to assess DNA content/cell cycle.
- Flow Cytometry: Analyze samples on a flow cytometer equipped with a 488nm laser. Measure FITC fluorescence (telomere signal) and far-red fluorescence (DNA content). Use the DNA stain to gate on G0/G1 phase cells for uniform ploidy.
- Data Analysis: Calculate the median FITC fluorescence of the G0/G1 population. Subtract the autofluorescence from a no-probe control. The net median fluorescence is proportional to the average telomere length. Generate a kilobase scale using control cell lines.
Diagrams and Workflows
Diagram Title: Decision and Workflow: Q-FISH vs. Flow-FISH for Telomere Analysis
Diagram Title: Integrating Q-FISH & Flow-FISH into CRISPR Telomere Research
The Scientist's Toolkit: Research Reagent Solutions
Table 3: Essential Reagents and Materials for Telomere FISH
| Item | Function / Description | Example/Notes |
|---|---|---|
| Cy3- or FITC-labeled (CCCTAA)₃ PNA Probe | High-affinity, sequence-specific probe complementary to the vertebrate telomere repeat (TTAGGG)n. Resistant to nucleases. | PNA probes from FANA Biosciences or Panagene. Stock at 100 µM in sterile water. |
| Deionized Formamide | A component of the hybridization buffer that lowers the melting temperature (Tm) of DNA, enabling specific PNA binding under controlled conditions. | Use molecular biology grade, deionized. Aliquot and store at -20°C. |
| Carnoy's Fixative (3:1 Methanol:Acetic Acid) | Preserves chromosomal morphology and fixes cells to slides (Q-FISH) or in suspension. Must be freshly prepared. | Use anhydrous reagents. Prepare in a fume hood. |
| Colcemid (Demecolcine) | Inhibits microtubule polymerization, arresting cells in metaphase for optimal chromosome spreading in Q-FISH. | Typical working concentration: 0.1 µg/mL. |
| Anti-fade Mounting Medium with DAPI | Preserves fluorescence during microscopy and provides a DNA counterstain to visualize chromosomes/nuclei. | Vectashield or ProLong Gold with DAPI. |
| Fluorescence Calibration Standards | Cells with known, stable telomere length (e.g., 1301 cell line, HeLa, or commercially available beads) essential for converting fluorescence to kilobases. | Critical for inter-experiment and inter-lab reproducibility. |
| RNase A | Degrades RNA in Flow-FISH protocol to prevent nonspecific PNA binding and reduce background. | Use DNase-free. Incubate at 37°C. |
| Flow Cytometer with 488nm Laser | Instrument for high-speed analysis of FITC fluorescence in single cells for Flow-FISH. | Must be calibrated daily. A 633nm/635nm laser is also needed for DNA content stains. |
| Metafer/TFL-Telo or Equivalent Software | Automated image analysis platforms for high-throughput scoring of telomere fluorescence intensity in Q-FISH images. | Alternatively, ImageJ/FIJI with specialized plugins can be used. |
1.0 Application Notes: Integrating CRISPR Imaging for Chromatin & Telomere Visualization in HCS
High-content screening (HCS) for CRISPR-based chromatin and telomere visualization presents unique challenges in balancing throughput, data richness, and analytical simplicity. This document outlines optimized protocols and reagent solutions to enhance scalability while maintaining rigorous experimental output for drug discovery and basic research.
Table 1: Quantitative Comparison of HCS-Compatible CRISPR Imaging Systems
| System/Technique | Primary Label | Typical Throughput (Plates/Day) | Z-Sections per Field | Required Analysis Complexity | Best Suited For |
|---|---|---|---|---|---|
| CRISPR-Sirius (dCas9-APEX2) | Biotinylation / Fluorescent Streptavidin | 4-6 (Fixed-Endpoint) | 1 (Max Projection) | Medium (Background Subtraction) | High-Resolution Telomere Mapping |
| CRISPR-LiveFISH | fluorescent oligonucleotides | 3-5 (Live/Fixed) | 5-7 | High (Deconvolution, Tracking) | Dynamic Telomere Movement |
| CRISPR-SunTag (scFv-GFP) | GFP | 2-4 (Live-Cell) | 10-15 | Very High (Super-Resolution) | Chromatin Nanoscale Architecture |
| Cas9-EGFP (Direct Fusion) | EGFP | 6-10 (Fixed-Endpoint) | 1 | Low (Simple Segmentation) | High-Throughput Locus Counting |
2.0 Experimental Protocols
2.1 Protocol: High-Throughput Fixed-Cell Screening for Telomere Length Quantification using CRISPR-Sirius
Aim: To quantitatively assess relative telomere length and morphology across a 384-well plate library of genetic or compound perturbations.
Materials: See "Research Reagent Solutions" below.
Methodology:
- Cell Seeding & Transfection: Seed HeLa or U2OS cells in a collagen-coated 384-well optical-bottom plate at 2,500 cells/well. 24h post-seeding, transfect with plasmid expressing TelC-targeting dCas9-APEX2-NLS using a lipid-based transfection reagent optimized for HCS.
- Biotinylation & Fixation: 48h post-transfection, treat cells with 1 mM H₂O₂ and 500 µM Biotin-phenol (in PBS) for 60 seconds. Immediately aspirate and wash 3x with quenching buffer (10 mM sodium ascorbate, 5 mM Trolox in PBS). Fix cells with 4% paraformaldehyde (PFA) for 15 min at RT.
- Permeabilization & Staining: Permeabilize with 0.5% Triton X-100 for 10 min. Block with 3% BSA for 1h. Incubate with Streptavidin-conjugated Alexa Fluor 594 (1:1000) and DAPI (1 µg/mL) in blocking buffer for 1h at RT. Wash 3x with PBS.
- HCS Imaging: Image using a confocal high-content imager (e.g., Yokogawa CV8000, ImageXpress Micro Confocal). Acquire 20X/0.75 NA objective images, 9 sites/well. Use DAPI for autofocus and nuclear segmentation. Acquire Alexa Fluor 594 signal with a 2 µm Z-step (3 sections) for max projection.
- Analysis Pipeline: Use instrument software (e.g., MetaXpress, Harmony) or CellProfiler. Segment nuclei via DAPI. Within each nucleus, identify telomere puncta (Alexa Fluor 594) using a spot-detection algorithm. Primary outputs: Puncta Count/Nucleus and Total Telomere Signal Intensity/Nucleus.
2.2 Protocol: Live-Cell Scalable Workflow for Chromatin Locus Tracking with CRISPR-LiveFISH
Aim: To monitor the spatial dynamics of a specific genomic locus in response to drug treatment over 24 hours in a 96-well format.
Methodology:
- Stable Line Generation: Create a cell line stably expressing dCas9-EGFP targeted to a specific chromatin region (e.g., MYC promoter). Select with puromycin for 2 weeks.
- Probe Transfection & Plating: Transfect cells with 50 nM of Cy5-labeled MYC-targeting LiveFISH guide oligonucleotide complexed with a transfection reagent. 6h post-transfection, trypsinize and seed into a 96-well glass-bottom plate at 8,000 cells/well in phenol-red-free medium. Incubate overnight.
- HCS Live-Cell Imaging: Place plate in an environmentally controlled (37°C, 5% CO₂) high-content live-cell imager (e.g., Incucyte SX5, Lionheart FX). Pre-equilibrate for 1h. Acquire images every 30 minutes for 24h using a 40X objective. Capture DIC, GFP (dCas9), and Cy5 (locus) channels.
- Dynamic Analysis: Use tracking software (e.g., TrackMate in ImageJ, or proprietary HCS software). For each time point, segment the nucleus via DIC or low-intensity GFP. Detect the Cy5 punctum within each nucleus. Calculate and export: Punctum Displacement (µm), Speed (µm/min), and Distance from Nuclear Center per time point.
3.0 The Scientist's Toolkit: Research Reagent Solutions
| Item | Function in HCS CRISPR Imaging | Example Product/Catalog # |
|---|---|---|
| dCas9-APEX2-NLS Plasmid | CRISPR-targeted enzymatic biotinylation for ultra-sensitive, fixed-endpoint detection. | Addgene #101041 |
| HCS-Optimized Lipid Transfection Reagent | Low-toxicity, high-efficiency transfection in multi-well formats. | Invitrogen Lipofectamine LTX with PLUS Reagent |
| Biotin-Phenol | Substrate for APEX2; becomes radicalized and biotinylates proximal proteins upon H₂O₂ addition. | Sigma-Aldrich, B1263 |
| Quenching Buffer Cocktail | Stops APEX2 reaction, reduces background fluorescence, and preserves morphology. | Homebrew: Sodium Ascorbate, Trolox, Sodium Azide. |
| Cell-Permeant Nuclear Stain | High-contrast, low-phototoxicity stain for live-cell nuclear segmentation in HCS. | SiR-DNA (Cytoskeleton, Inc.) |
| CRISPR LiveFISH Oligonucleotide Kit | Fluorescently labeled oligonucleotides for live-cell DNA imaging via dCas9 hybridization. | GattaFISH Live Labeling Probes |
| Phenol-Red-Free, Low-Autofluorescence Medium | Essential for live-cell imaging to minimize background in fluorescent channels. | FluoroBrite DMEM (Gibco) |
| Anti-Fade Mounting Medium | Preserves fluorescence signal for fixed plates intended for re-analysis. | ProLong Glass Antifade Mountant |
4.0 Visualized Workflows and Pathways
HCS CRISPR Imaging Workflow Decision Tree
CRISPR-APEX2 Proximity Labeling Pathway
Within the broader thesis on CRISPR-based imaging for chromatin architecture and telomere visualization, a rigorous cost-benefit analysis is essential. This document provides detailed application notes and protocols, focusing on the economic and practical considerations of implementing live-cell CRISPR imaging systems. The analysis is critical for researchers, scientists, and drug development professionals aiming to balance experimental rigor with budgetary and temporal constraints.
Table 1: Comparative Cost-Benefit Analysis of Key CRISPR Imaging Systems
| System Component | Approx. Cost (USD) | Key Benefit | Time Investment | Instrumentation Need (Specialized) |
|---|---|---|---|---|
| dCas9-EGFP (Plasmid) | $75 - $150 | Standard, flexible targeting | 2-3 days (transfection + expression) | Standard epifluorescence microscope |
| dCas9 fused to SunTag (10x-24x scFv-GFP) | $300 - $600 | High signal amplification | 4-5 days (multipart assembly) | High-sensitivity camera (EMCCD/sCMOS) |
| dCas9 with *HaloTag/SNAP-tag* | $200 - $400 | Bright, photostable organic dyes | 1-2 days (labeling post-expression) | Standard confocal or STORM/PALM for super-res |
| Telomere-specific sgRNA (e.g., TelG) | $60 - $120 per synthesis | High specificity for telomeric repeats | 1 day (design/validation) | N/A |
| Chromatin-labeling sgRNA library (e.g., for SatIII) | $500 - $2000 | Multiplexed locus imaging | 1-2 weeks (screening/optimization) | Microscope with multi-color capability |
| Commercial CRISPR Imaging Kit (e.g., from Applied Biological Materials) | ~$1,200 | Optimized, off-the-shelf reagents | 1-2 days | As per included fluorescent protein |
| LNA FISH Probes (Alternative for Telomeres) | ~$400 per target | No transfection, direct detection | 1 day (hybridization) | Fluorescence microscope with appropriate filter |
Table 2: Time Investment Breakdown for Endogenous Telomere Visualization
| Protocol Stage | Hands-on Time | Total Time | Critical Notes |
|---|---|---|---|
| 1. Plasmid Preparation | 1.5 hours | 2-3 days | Amplification, purification, quantification. |
| 2. Cell Transfection & dCas9 Expression | 1 hour | 24-48 hours | Lipofectamine 3000 or electroporation. |
| 3. sgRNA Delivery/Co-expression | 30 min | 24-48 hours (if co-transfected) | Often cloned into same plasmid as dCas9. |
| 4. Sample Preparation & Mounting | 1 hour | 1-2 hours | For live imaging: chambered coverslips. |
| 5. Imaging & Data Acquisition | Variable | 30 min - several hours | Depends on number of samples/conditions. |
| 6. Image Analysis (e.g., spot counting) | Variable | 1 hour - 1 day | Software: FIJI/ImageJ, commercial packages. |
Experimental Protocols
Protocol 3.1: Live-Cell Imaging of Telomeres using dCas9-EGFP and Telomeric sgRNA
Aim: To visualize endogenous telomere loci in live human cells (e.g., U2OS) using a CRISPR-based labeling system.
Materials (Scientist's Toolkit):
- Cell Line: U2OS osteosarcoma cells (highly transfectable, large cytoplasm).
- Plasmids: pCRISPR-dCas9-EGFP (Addgene #84475) and pSLQ-sgRNA-TelG (targeting TTAGGG repeats).
- Transfection Reagent: Lipofectamine 3000.
- Imaging Medium: FluoroBrite DMEM + 10% FBS + 1% GlutaMAX.
- Imaging Dish: 35mm glass-bottom dish (No. 1.5 coverglass).
- Microscope: Spinning disk confocal or widefield epifluorescence with a 63x/100x oil objective, environmental chamber (37°C, 5% CO₂).
Procedure:
- Day 1: Cell Seeding. Seed 2x10^5 U2OS cells into the glass-bottom dish in complete growth medium. Incubate 24h to reach ~70% confluency.
- Day 2: Transfection.
- Prepare two tubes:
- Tube A: 125µL Opti-MEM + 1.5µL Lipofectamine 3000.
- Tube B: 125µL Opti-MEM + 500ng dCas9-EGFP plasmid + 500ng sgRNA-TelG plasmid + 2µL P3000 reagent.
- Combine Tube A and B, mix gently, incubate 15 min at RT.
- Add dropwise to cells. Incubate for 6h, then replace with fresh complete medium.
- Prepare two tubes:
- Day 3-4: Expression. Allow 24-48h for robust expression of dCas9-EGFP and sgRNA.
- Day 4/5: Live Imaging.
- Replace medium with pre-warmed Imaging Medium.
- Mount dish on microscope stage within environmental chamber.
- Acquisition Parameters: Use 488nm laser (low power, 1-5% to minimize photobleaching). Acquire z-stacks (0.5µm steps) or single-plane time-lapse images. Exposure time: 100-500ms.
- Controls: Image cells expressing dCas9-EGFP with a non-targeting sgRNA.
Protocol 3.2: Cost-Effective Validation via Fixed-Cell Co-localization with FISH
Aim: To validate CRISPR-labeled telomeres by co-localization with established Telomere FISH, confirming specificity before committing to live experiments.
Materials:
- Cells: Post-transfection cells from Protocol 3.1.
- Fixative: 4% Paraformaldehyde (PFA) in PBS.
- Permeabilization Buffer: 0.5% Triton X-100 in PBS.
- Hybridization Buffer: 70% Formamide, 1% BSA, 10mM Tris pH 7.4 in 2x SSC.
- TelC-Cy3 PNA FISH Probe: (e.g., from Agilent Dako).
- DAPI: For nuclear counterstain.
- Mounting Medium: Antifade mounting medium.
Procedure:
- Fixation: Wash cells with PBS, fix with 4% PFA for 10 min at RT. Wash 3x with PBS.
- Permeabilization: Incubate with 0.5% Triton X-100 for 15 min. Wash 2x with PBS.
- FISH Denaturation/Hybridization:
- Dehydrate cells in 70%, 85%, 100% ethanol series (3 min each). Air dry.
- Apply 20µL of hybridization buffer containing the TelC-Cy3 PNA probe.
- Place a coverslip, seal with rubber cement.
- Denature on a hot block at 80°C for 5 min.
- Hybridize in a dark, humid chamber at RT for 2h.
- Washing & Mounting:
- Remove coverslip and wash stringently: 2x in 70% formamide/10mM Tris (pH 7.4) for 15 min, then 3x in PBS.
- Counterstain with DAPI (1µg/mL) for 5 min.
- Wash, mount with antifade medium.
- Imaging: Acquire images for EGFP (CRISPR), Cy3 (FISH), and DAPI channels. Analyze co-localization using Pearson's correlation coefficient.
Visualizations: Workflows and Pathways
Diagram Title: CRISPR Imaging Project Decision & Validation Workflow
Diagram Title: Core CRISPR Imaging Complex Assembly & Signal Generation
The Scientist's Toolkit: Essential Reagent Solutions
Table 3: Key Research Reagent Solutions for CRISPR Imaging
| Reagent/Material | Supplier Examples | Function in Experiment | Cost-Benefit Consideration |
|---|---|---|---|
| dCas9-Fluorescent Protein Plasmid | Addgene, Sino Biological | Provides catalytically dead Cas9 scaffold fused to a fluorescent reporter (e.g., EGFP, mCherry). Core of the imaging system. | Addgene plasmids are cost-effective for academia. Commercial sources offer guaranteed QC and support. |
| sgRNA Cloning Vector | Addgene (e.g., pSLQ, pU6) | Backbone for expressing custom single guide RNAs targeting specific genomic loci (e.g., telomeres, satellite repeats). | Cloning your own is inexpensive but time-consuming. Pre-validated sgRNA vectors save time but cost more. |
| Lipofectamine 3000 | Thermo Fisher Scientific | Cationic lipid reagent for efficient co-delivery of dCas9 and sgRNA plasmids into mammalian cells. | Industry standard. Cost per transfection is moderate. Optimization may be needed for sensitive cells. |
| FluoroBrite DMEM | Thermo Fisher Scientific | Low-autofluorescence imaging medium. Maintains cell health while drastically reducing background noise. | Critical for high-sensitivity live-cell imaging. More expensive than standard DMEM but essential for quality data. |
| Telomere-Specific PNA FISH Probe (Cy3-labeled) | Agilent Dako, PNA Bio | Fluorescently locked nucleic acid probe for validating telomere targeting via co-localization in fixed cells. | High specificity and brightness. Relatively high cost per test, but validation is crucial before live studies. |
| Antifade Mounting Medium with DAPI | Vector Labs, SouthernBiotech | Preserves fluorescence in fixed samples and provides nuclear counterstain for segmentation. | Small volume is sufficient for many samples. Essential for reproducible fixed-cell imaging. |
| Glass-Bottom Culture Dishes | MatTek, CellVis | Provide optimal optical clarity for high-resolution microscopy while allowing cell culture. | Significant per-unit cost. Reusable dishes can reduce long-term expenses. |
This application note is framed within a broader thesis investigating chromatin architecture and telomere dynamics via CRISPR imaging. The integration of live-cell CRISPR imaging with population-averaged, high-resolution molecular datasets (Hi-C and ChIP-seq) is critical for moving from correlative spatial observations to mechanistic insights into gene regulation and nuclear organization. These protocols enable the validation of imaging-based structural hypotheses with biochemical data and vice versa.
Application Notes: Data Correlation & Interpretation
Key Correlative Insights
Integrative analysis can resolve discrepancies and provide multi-scale validation. Primary applications include:
- Validating CRISPR-labeled genomic loci: Confirming that a visualized foci corresponds to a specific genomic region defined by ChIP-seq peaks or Hi-C contact domains.
- Linking dynamic behavior to epigenetic state: Correlating motility, compaction, or interaction frequency of a CRISPR-imaged locus with histone modification marks (e.g., H3K27ac, H3K9me3) from ChIP-seq.
- Interpreting Hi-C loops and TADs in single cells: Using dual-color CRISPR imaging to visualize the physical co-localization frequency of two genomic elements shown to be interacting in Hi-C data.
- Telomere visualization in context: Correlating telomere CRISPR signal intensity (as a proxy for length or integrity) with subtelomeric chromatin state from ChIP-seq and its spatial positioning relative to nuclear lamina from imaging.
Table 1: Key Metrics for Cross-Validation Between Techniques
| Dataset Type | Primary Metric | Typical Resolution | Correlative Parameter from CRISPR Imaging | Interpretation of Correlation |
|---|---|---|---|---|
| Hi-C | Contact Probability | 1 kb - 100 kb | Inter-locus Distance (μm) / Co-localization Frequency (%) | Negative correlation: Higher contact frequency often corresponds to shorter average spatial distance. |
| ChIP-seq | Read Peak Height (Fold-Enrichment) | 100 - 500 bp | Fluorescence Intensity / Signal Stability | Positive correlation: High enrichment of active marks (e.g., H3K36me3) often correlates with brighter, more stable CRISPR signals due to more open chromatin. |
| CRISPR Imaging | Mean Square Displacement (MSD) | Single Locus (~250 nm) | N/A (Independent measurement) | Loci with low MSD (constrained) often reside in domains with repressive ChIP-seq marks (e.g., H3K9me3) and strong intra-TAD Hi-C contacts. |
| Integrated | Spearman's Rank Correlation Coefficient (ρ) | N/A | N/A | Used to statistically assess the relationship between imaging-based distance matrices and Hi-C contact matrices for the same genomic region. |
Detailed Experimental Protocols
Protocol 1: Cell Preparation for Integrative Analysis
Aim: Generate isogenic cell samples for parallel CRISPR imaging, Hi-C, and ChIP-seq.
- Cell Line Engineering: Stably integrate a doxycycline-inducible dCas9-EGFP (or SunTag) expression system into your diploid cell line (e.g., HeLa, RPE-1, or a relevant disease model).
- sgRNA Transfection: For imaging, transfert with plasmids expressing telomere-specific (e.g., sequence:
TTAGGG) or locus-specific sgRNAs. For biochemical assays, use a separate aliquot of the same engineered cell line. - Sample Division:
- Imaging Sample: Plate cells on 35mm glass-bottom dishes. Induce dCas9-EGFP expression with 1 μg/mL doxycycline 24h prior to imaging.
- Hi-C Sample: Grow ≥1x10^6 cells in a 10cm dish to ~90% confluence. Cross-link with 2% formaldehyde for 10 min at room temperature. Quench with 0.125M glycine.
- ChIP-seq Sample: Grow ≥1x10^6 cells. Cross-link with 1% formaldehyde for 10 min. Quench, harvest, and pellet.
Protocol 2: Live-Cell CRISPR Imaging for Telomere Visualization
Aim: Acquire dynamic spatial data for telomeres.
- Imaging Setup: Use a spinning-disk confocal or widefield microscope with a 63x/100x oil objective, environmental chamber (37°C, 5% CO2). Acquire z-stacks (7 slices, 0.5μm step) every 5-10 seconds for 5-10 minutes.
- Data Acquisition: For each cell, capture:
- A single time-point 3D image of dCas9-EGFP signal (telomeres).
- A DAPI channel for DNA segmentation.
- Optional: A marker for nuclear lamina (e.g., Lamin B1-mCherry).
- Analysis (FIJI/ImageJ):
- Apply a mild Gaussian blur (σ=0.5). Use the "Find Maxima" function with a noise tolerance to identify telomere foci.
- Track foci over time using the TrackMate plugin. Export XYZ coordinates and track statistics (MSD, diffusion coefficient).
Protocol 3: Hi-C Library Preparation from Cross-linked Cells
Aim: Generate in-situ Hi-C libraries compatible with downstream correlation.
- Chromatin Processing: Lyse cross-linked cells. Digest chromatin with 100 units of MboI or DpnII restriction enzyme overnight.
- Proximity Ligation: Fill in restriction overhangs with biotinylated nucleotides. Perform proximity ligation in a large volume with T4 DNA ligase.
- DNA Purification & Shearing: Reverse cross-links, purify DNA. Shear to ~300-500 bp using a Covaris sonicator.
- Biotin Pull-down & Library Prep: Pull down biotin-labeled ligation junctions with streptavidin beads. Perform end-repair, A-tailing, and adapter ligation on-bead. PCR-amplify (8-12 cycles) and purify the final library for sequencing (Illumina NovaSeq, PE150).
Protocol 4: ChIP-seq for Histone Modifications
Aim: Profile epigenetic state of regions of interest.
- Chromatin Shearing: Sonicate cross-linked chromatin to an average size of 200-500 bp. Immunoprecipitate with 2-5 μg of target-specific antibody (e.g., anti-H3K9me3, anti-H3K27ac) and Protein A/G beads overnight at 4°C.
- Wash & Elution: Wash beads stringently. Reverse cross-links and purify DNA.
- Library Prep & Sequencing: Prepare sequencing libraries from ChIP and Input DNA using a standard kit (e.g., NEBNext Ultra II). Sequence on an Illumina platform (SE50 or PE75).
Protocol 5: Computational Correlation Workflow
Aim: Integrate imaging, Hi-C, and ChIP-seq data.
- Align & Process Hi-C/ChIP-seq: Use HiC-Pro (Hi-C) and Bowtie2/MACS2 (ChIP-seq) for alignment and peak calling. Generate contact matrices (Hi-C) and bigWig coverage files (ChIP-seq).
- Map Imaging Loci to Genome: Use the sgRNA target sequence to define the genomic coordinate of the imaged locus. Extract Hi-C contact frequencies and ChIP-seq signal intensities in a +/- 50-100 kb window.
- Correlation Analysis:
- Imaging vs. Hi-C: Calculate the population-averaged mean spatial distance between two loci from >100 cells. Plot against the normalized contact frequency from Hi-C. Calculate Spearman's ρ.
- Imaging vs. ChIP-seq: Plot the distribution of CRISPR signal intensity or loci motility against the normalized ChIP-seq read density for the relevant mark.
Diagrams
Title: Integrative Analysis Experimental Workflow
Title: Logic of Multi-Dataset Question Resolution
The Scientist's Toolkit: Research Reagent Solutions
Table 2: Essential Materials for Integrated CRISPR Imaging Studies
| Item Name | Supplier Examples | Function in Protocol |
|---|---|---|
| dCas9-EGFP Expression Plasmid | Addgene (pCRISPRia-v2, pSLQ1661) | Stable integration provides consistent, inducible expression of the CRISPR imaging scaffold. |
| Telomere-repeat sgRNA Plasmid | Custom synthesis (IDT, Twist Bioscience) | Targets dCas9 to telomeres for visualization of nuclear periphery dynamics. |
| Lamin B1-mCherry Plasmid | Addgene | Labels nuclear lamina for spatial reference of peripheral chromatin positioning. |
| Doxycycline Hyclate | Sigma-Aldrich | Inducer for dCas9 expression in inducible cell lines; precise control over timing/level. |
| Formaldehyde (16-37%) | Thermo Fisher Scientific | Cross-linking agent for fixing chromatin interactions (Hi-C) and protein-DNA binding (ChIP-seq). |
| MboI / DpnII Restriction Enzyme | NEB | Cuts frequently in mammalian genomes to generate Hi-C contact fragments. |
| Biotin-14-dATP | Thermo Fisher Scientific | Labels digested DNA ends during Hi-C library prep for specific pull-down of ligation junctions. |
| Streptavidin C1 Beads | Invitrogen | Solid-phase support for efficient capture of biotinylated Hi-C fragments. |
| Validated Histone Modification Antibody | Cell Signaling, Abcam, Diagenode | Specific immunoprecipitation of chromatin bearing target epigenetic mark for ChIP-seq. |
| NEBNext Ultra II DNA Library Prep Kit | NEB | High-efficiency library preparation from low-input ChIP or Hi-C DNA. |
| Glass-bottom Imaging Dishes (35mm) | MatTek, CellVis | High-quality substrate for high-resolution live-cell microscopy with minimal aberration. |
CRISPR imaging systems, particularly those utilizing catalytically inactive dCas9 fused to fluorescent proteins (e.g., dCas9-EGFP), have emerged as transformative tools for visualizing endogenous genomic loci in live cells. In the study of Telomere Biology Disorders (TBDs) like Dyskeratosis Congenita (DC), this technology allows for the direct, real-time observation of telomere dynamics, morphology, and protein interactions without the need for fixed samples or exogenous probes. This case study outlines a framework for validating CRISPR-based telomere imaging findings in DC patient-derived cell models, connecting observed telomeric aberrations (e.g., excessive shortening, fragility, altered clustering) to underlying genetic lesions in genes such as DKC1, TERC, TERT, and RTEL1. The validation is critical for confirming that imaging phenotypes are disease-specific and not artifacts of the CRISPR labeling process itself. This protocol is situated within a broader thesis on CRISPR chromatin visualization, emphasizing rigorous orthogonal validation as a cornerstone for credible imaging research with translational implications for drug discovery.
Table 1: Representative CRISPR Imaging Data from DC vs. Control Cells
| Parameter | Healthy Control Fibroblasts (Mean ± SD) | DKC1-Mutant DC Fibroblasts (Mean ± SD) | p-value | Validation Method Used |
|---|---|---|---|---|
| Telomere Length (by imaging signal intensity) | 1.0 ± 0.15 (AU) | 0.55 ± 0.22 (AU) | <0.001 | qFISH / Telomere Restriction Fragment |
| Number of Telomere Foci per Nucleus | 40 ± 6 | 42 ± 8 | 0.25 | DNA-FISH |
| Telomere Clustering (% nuclei with >3 clusters) | 5% ± 3% | 28% ± 9% | <0.001 | 3D-SIM Super-resolution |
| Telomere Dysfunction-Induced Foci (TIFs) per nucleus (γH2AX colocalization) | 0.5 ± 0.5 | 4.2 ± 1.8 | <0.001 | Immunofluorescence |
| dCas9-EGFP Labeling Efficiency (% of telomeres labeled) | 78% ± 10% | 75% ± 12% | 0.40 | Correlation with TelC-Alexa647 FISH |
Table 2: Orthogonal Validation Techniques Comparison
| Technique | Measures | Throughput | Resolution | Key Advantage for Validation |
|---|---|---|---|---|
| Quantitative FISH (qFISH) | Absolute telomere length, aberrations | Medium | ~200 nm | Gold standard for length; validates intensity metrics. |
| Telomere Restriction Fragment (TRF) Southern Blot | Bulk telomere length distribution | Low | N/A | Biochemical length confirmation; no probe bias. |
| DNA-FISH with PNA-TelC Probe | Telomere position, number, morphology | Medium | ~200 nm | Validates CRISPR labeling specificity and efficiency. |
| Immunofluorescence for DNA Damage (γH2AX, 53BP1) | Telomere dysfunction, TIFs | Medium | ~250 nm | Confirms biological relevance of observed damage. |
| STED/SIM Super-resolution Imaging | Nanoscale telomere architecture | Low | ~20-100 nm | Validates clustering/morphology at high resolution. |
Detailed Experimental Protocols
Protocol 1: CRISPR/dCas9-EGFP Live-Cell Telomere Imaging in DC Patient Cells
Objective: To label and image telomeres in live DC and isogenic corrected cells.
- Cell Line Preparation: Culture patient-derived fibroblasts (e.g., DKC1 mutant) and an isogenic control (corrected via CRISPR-mediated gene editing) in appropriate medium.
- sgRNA Design and Cloning: Design two distinct sgRNAs targeting the TTAGGG repeat array. Clone into a lentiviral sgRNA expression vector (e.g., lentiGuide-Puro).
- Lentiviral Production: Co-transfect HEK293T cells with the sgRNA vector, dCas9-EGFP expression vector (e.g., lenti-dCas9-EGFP), and packaging plasmids (psPAX2, pMD2.G).
- Cell Line Generation: Transduce target fibroblasts with lentivirus containing dCas9-EGFP and telomere-specific sgRNAs. Select with puromycin and blasticidin for 7 days.
- Live-Cell Imaging: Seed stable cells onto glass-bottom dishes. 24h later, replace medium with live-cell imaging medium. Using a confocal microscope with environmental control (37°C, 5% CO₂), acquire z-stacks (0.5 µm steps) through the nucleus using a 63x/1.4 NA oil objective at 488 nm excitation. Limit laser power and exposure to minimize phototoxicity.
- Image Analysis: Use FIJI/ImageJ to create maximum intensity projections. Apply a consistent threshold and use the "Analyze Particles" function to quantify telomere number, intensity (proxy for length), and nuclear distribution.
Protocol 2: Orthogonal Validation by Quantitative FISH (qFISH)
Objective: To validate telomere length and number measurements from CRISPR imaging.
- Cell Fixation: Culture matched cells on slides, treat with colcemid (0.1 µg/mL, 2h), and hypotonic solution (0.075 M KCl, 20 min). Fix in 3:1 methanol:acetic acid.
- Slide Aging and Digestion: Age slides overnight, treat with pepsin (0.01% in 0.01N HCl, 10 min, 37°C), and dehydrate in ethanol series.
- Hybridization: Apply 10 µL of hybridization mixture containing a Cy3-labeled (CCCTAA)3 PNA probe (PNA Bio, 0.5 µg/mL) in 70% formamide, 10 mM Tris pH 7.5, and blocking reagents. Denature slides and probe together at 80°C for 5 min, then incubate in a dark humid chamber at room temperature for 2h.
- Post-Hybridization Washes: Wash twice in 70% formamide, 10 mM Tris pH 7.5 (15 min each), followed by three washes in PBS with 0.1% Tween-20.
- Counterstaining and Mounting: Stain with DAPI (0.1 µg/mL) and mount with antifade medium.
- Image Acquisition and Analysis: Acquire metaphase spreads and interphase nuclei using a fluorescence microscope with a 63x objective. Use dedicated qFISH software (e.g., Telometer, or FIJI plugins) to measure telomere fluorescence intensity (in Telomeric Units - TU) for each telomere spot. Compare the distribution of intensities to the dCas9-EGFP signal intensities from Protocol 1.
The Scientist's Toolkit: Research Reagent Solutions
Table 3: Essential Reagents for CRISPR Telomere Imaging & Validation
| Item | Function | Example Product/Catalog # (Representative) |
|---|---|---|
| dCas9-EGFP Lentiviral Vector | Provides scaffold for telomere targeting and fluorescent signal. | Addgene #114199 (pLV-dCas9-EGFP) |
| Telomere-specific sgRNA Cloning Vector | Expresses guide RNA to direct dCas9-EGFP to TTAGGG repeats. | Addgene #52963 (lentiGuide-Puro) |
| Cy3-labeled TelC PNA Probe | For orthogonal FISH validation of telomere location and length. | PNA Bio, F1002 (Cy3-OO-CCCTAACCCTAA) |
| Anti-γH2AX (phospho S139) Antibody | Detects DNA damage foci at telomeres (TIFs) via IF. | MilliporeSigma, 05-636 (clone JBW301) |
| TRF Southern Blot Kit | Gold-standard biochemical telomere length analysis. | Roche, 08984944001 (TeloTAGGG) |
| Live-Cell Imaging Medium | Maintains cell health during prolonged time-lapse imaging. | Thermo Fisher, A1896701 (FluoroBrite DMEM) |
| Lentiviral Packaging Plasmids | Essential for producing transduction-ready viral particles. | Addgene #12260 (psPAX2), #12259 (pMD2.G) |
Diagrams and Workflows
Title: CRISPR Telomere Imaging Validation Workflow for DC
Title: Core Pathogenic Pathway in Dyskeratosis Congenita
Conclusion
CRISPR-based imaging has fundamentally transformed our ability to visualize chromatin dynamics and telomere biology in living cells, offering unprecedented spatial and temporal resolution. By moving beyond static snapshots to dynamic tracking, researchers can now interrogate genomic architecture and telomere maintenance in real-time within relevant physiological and disease contexts. While methodological challenges around signal specificity and quantification persist, ongoing optimization of reporter systems and multiplexing strategies continues to push the boundaries. The integration of CRISPR imaging data with orthogonal genomics and structural biology techniques promises a more holistic understanding of nuclear organization. For drug development, this technology provides a powerful platform for visualizing target engagement, monitoring epigenetic drug effects, and modeling diseases of genomic instability, paving the way for novel therapeutic strategies in oncology and aging-related disorders.